Sydney and Melbourne have been the first capital city housing markets to record negative monthly growth rates this year, joined most recently by Hobart in April, its first fall after 22 consecutive months of growth.
But within each of those areas as well as Australia’s other capital cities, micro-market trends are emerging, coinciding with higher interest rates, rising stock levels, lower confidence, and a limit to how much buyers are willing or able to spend.
The suburbs which recorded the lowest quarterly change in value growth for the three months to April, listed here, highlights predominantly inner city and upper quartile suburbs found in Sydney, Melbourne and Canberra.
In cities still recording an upswing in values such as Brisbane, underperforming suburbs are more skewed towards high-density areas weighed down by a high proportion of units. In Adelaide and Perth, suburbs that may be classified as unaffordable dominated the list.
CoreLogic Research Director Tim Lawless said most of the areas identified registered upper quartile housing values, with a median well in excess of the broader region.
“We are seeing this trend more broadly, where the upper quartile of the market has softened out more visibly than the middle to lower end of the market,” he said.
“These softer conditions come after a stronger performance across the premium end of the market through the growth phase. Historically more expensive housing markets tend to lead the upswing, but also lead the downturn, which is what we seem to be seeing at the moment.”
Exceptions to the upper quartile trend can be found among Brisbane suburbs. The city as a whole remains in an upswing phase, with values up 29.8% in the year to April. However, among the growth are sectors of the market which haven’t performed as well, such as higher density inner ring suburbs including South Brisbane and West End where slight falls in values were recorded in the last three months.
In Darwin, a handful of the city’s more affordable suburbs are ranked lowest for growth rates possibly due to less constraints on housing affordability. Mr Lawless said the dwelling value to income ratio in Australia’s top end is far lower, at 3.9, relative to other capital cities, which could be underpinning demand among buyers upgrading.
Ahead of CoreLogic’s monthly Home Value Index release on June 1, Head of Research Eliza Owen said in a downturn, expensive, and more leveraged suburbs, were sensitive to changes in credit conditions.
She said while the characteristics had long been observed in the real estate sector, the RBA also published similar research insights in 2020.
“Higher income households tend to hold more housing debt to income, so do property investors,” Ms Owen said.
“That’s why the high end of the market can often be more sensitive to changes in interest rates or credit conditions, but this can also affect some other popular investment markets like inner city areas.”
The biggest common factor across Sydney and Melbourne, and house markets in these cities more broadly, is the potential for higher volatility among more expensive pockets.
“These are also areas that have experienced some of the most extraordinary gains through the cycle, and have been a bellwether for other parts of the market historically,” Ms Owen said.
“If we take Beaconsfield in Sydney’s inner city for example, it may look like the area has not had much growth, but that’s because it had a much earlier cyclical peak, at annual growth of 33.7% back in the 12 months to October 2021.
“Sharp deterioration in demand across the suburb has now dragged down the annual growth rate to just 2%. The same can be said for houses in Surry Hills in Sydney’s inner east, where annual growth peaked at 28.9% in the same month, and nearby Darlinghurst at 26.9%. These higher-end house markets generally have higher peaks in growth during boom times and sharper declines in the downswing phase.”
Considering dwelling values – the combination of houses and units – Ms Owen identifies clear trends particularly among new buyers, who are not able to pay vendor prices due to limited borrowing power and the affordability ceiling, which will impact some of the more expensive parts of each market.
“There tends to be micro-markets where dynamics such as stretched affordability can manifest in a single suburb pushing buyers into the next most affordable suburb,” she said.
“One good example of this is Newtown, a dynamic and popular suburb in Sydney’s inner west. It’s also relatively expensive with a median dwelling value of almost $1.5 million yet it recorded a quarterly decline of -5.5%, which suggests buyers may be at their limit and are being forced to find alternative options within their budgets.”
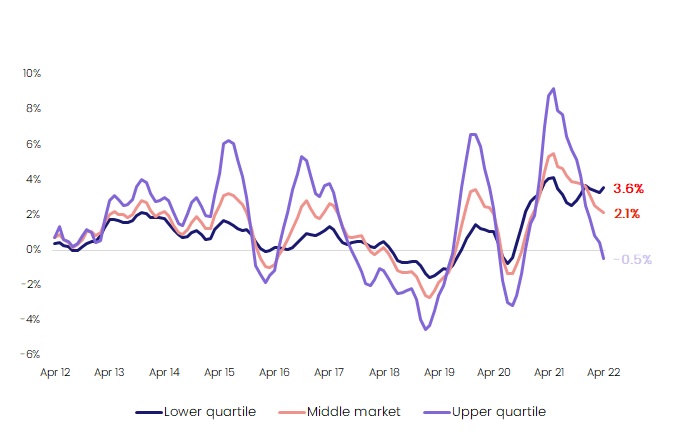
An analysis of the lower, middle and upper quartile markets highlights the volatility of higher value areas, which is currently leading the downturn.
Quarterly change in dwelling values, Combined capitals

Meet Tim Lawless
Executive, Research Director, Asia-Pacific
Tim is executive research director of CoreLogic’s Asia–Pacific research division, managing a team of economic and data specialists across Australia and New Zealand. He brings more than 20 years’ experience to the role, providing deep insights and analysis on national housing trends.
Full profile