The residential property markets of Australia’s two largest cities have hit their first quarter of negative territory since the extended lockdowns of 2020.
Sydney and Melbourne’s market slowdown has seen CoreLogic’s national Home Value Index (HVI) continue to lose steam through April. Housing values are still rising at the national level, however the 0.6% monthly rate of growth is the lowest reading since October 2020.
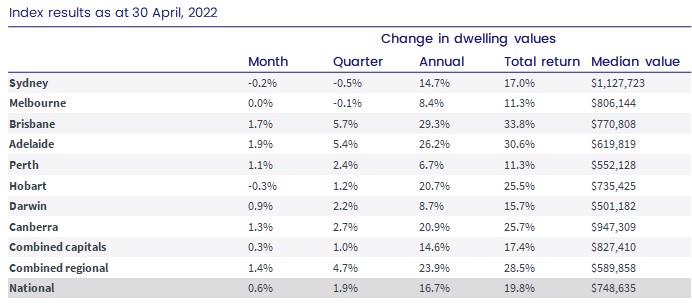
Sydney and Melbourne, which have the heaviest weighting in the HVI, were the main drag on the headline growth rates. Sydney housing values recorded the third consecutive month-on-month decline, down 0.2%, while Melbourne values were flat (-0.04% when taken out to the second decimal place). Technically values are down over three of the past five months in Melbourne. Hobart also recorded a negative monthly change (-0.3%), the city’s first monthly fall in 22 months.
CoreLogic’s Research Director Tim Lawless says the weakening state of the market has taken the rolling quarterly trend into negative territory across Sydney and Melbourne for the first time since these cities were in the midst of extended lockdowns in mid-to-late 2020.
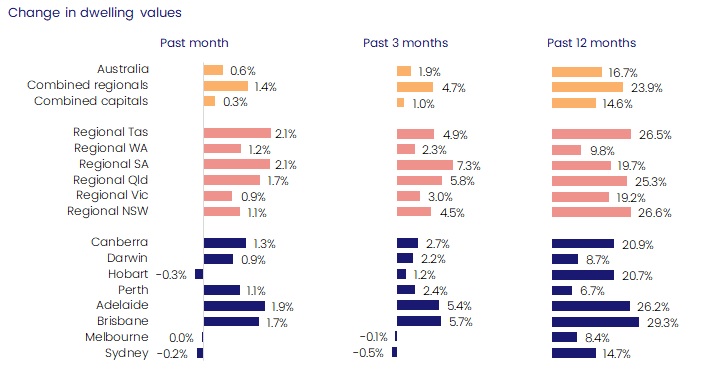
Demonstrating the diversity in housing conditions across the broad regions of Australia, half of the capitals are still recording a monthly growth rate above 1%. Adelaide, at 1.9% growth in April, led the pace of capital gains, followed by Brisbane (1.7%), Canberra (1.3%) and Perth (1.1%).
Although monthly growth rates remain high in these markets, Mr Lawless warns the trend rate of growth is easing in most of these areas as well. Based on rolling quarterly change,Brisbane dwellings moved through a peak rate of growth in December last year at 8.5%, slowing to 5.7% over the most recent three month period. Similarly, Adelaide moved through a peak in the trend rate of growth in January at 7.4%, reducing to 5.4% in April.
Perth and Darwin are the exceptions, where the rolling quarterly trend has gathered some steam since late last year. Perth housing values were up 2.4% over the three months ending April compared with a recent lull through late last year when the quarterly trend fell to just 0.4%.
“A rebound in migration rates as state and international borders re-opened could partially explain the renewed exuberance, along with persistently low advertised stock levels and strong economic conditions,” Mr Lawless says.
“While ABS internal migration data by greater capital city is currently only reported to June 2021, the data points to a vast uplift in internal migration to Perth for the year (6,468), a substantial turn-around from the previous four-year average (-3,735).”
Regional Australian housing markets have been somewhat insulated from the slowdown, with housing values up 1.4% in April across the combined regionals index, compared with a 0.3% gain across the combined capitals. Advertised stock levels remain 42% below the previous five-year average in the regions, while the volume of home sales is holding 20% above the previous five-year average. The imbalance between available supply and demonstrated demand is a key factor supporting growth in housing prices across Regional Australia, however the trend rate of growth is generally slowing as affordability constraints become more challenging.
The annual growth trend in home values is now falling sharply, with the national reading dropping from a recent peak of 22.2% growth over the year ending November 2021, to 16.7% over the most recent 12-month period.
As the stronger months of capital gain from early 2021 fall out of the 12-month calculation, Mr Lawless says we will see the annual change reducing more sharply over the coming months.
“With the RBA cash rate set to rise, potentially as early as tomorrow, we are likely to see a further loss of momentum in housing conditions over the remainder of the year and into 2023,” he says.
“Stretched housing affordability, higher fixed term mortgage rates, a rise in listing numbers across some cities and lower consumer sentiment have been weighing on housing conditions over the past year. As the cash rate rises, variable mortgage rates will also trend higher, reducing borrowing capacity and impacting borrower serviceability assessments.”
Persistently low levels of property listings help to explain the strength across the smaller capitals and regional markets.
Advertised inventory, at a national level, is tracking almost 30% below the previous five-year average over the four weeks ending April 24 at the national level. However, a more detailed analysis of each capital city highlights significant differences in the total number of homes available to purchase.
Total advertised inventory is more than 20% below levels from a year ago in Brisbane and Adelaide, and around 40% lower than the previous five-year average in both cities. The flow of new listings has generally been higher than normal in these markets; the shortage of available housing inventory in these markets is more due to a rapid rate of absorption as homes sell quickly amidst high demand.
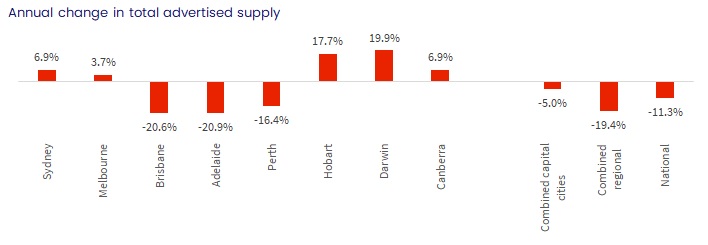
In weaker markets like Melbourne and Sydney, advertised supply levels have normalised. Sydney's advertised stock levels are roughly in line with the previous five-year average, while listings in Melbourne were 8.2% higher. Higher stock levels across these markets can be explained by an above average flow of new listings coming on the market in combination with a drop in buyer demand.
In Hobart, where April’s -0.3% decline follows 22 consecutive months of growth, stock levels started to increase in the middle of March. The new listing count is now 46% higher over the four weeks to April 24 compared to the same period in 2021.
“With higher inventory levels and less competition, buyers are gradually moving back into the driver’s seat. That means more time to deliberate on their purchase decisions and negotiate on price,” Mr Lawless says.
Softening buyer demand can be seen in fewer home sales. The trend in housing turnover peaked at a record high through the December quarter last year. Estimated sale settlements since have fallen, with the quarterly number of home sales nationally estimated to be 14.0% lower relative to the same time a year ago.
Rental markets are also showing multi-speed conditions, with most of the capital cities experiencing an upward trend in rental growth in 2022. Nationally, rents were up 2.7% over the three months to April, taking the annual change in national rents to 9.0%. A year ago, the annual change in national rents was 4.9%.
Based on the annual change, house rents (+9.1%) are rising faster than unit rents (+8.7%), however this trend is changing sharply as demand for unit rentals increases.
“On a rolling quarterly basis, we are now seeing unit rents rising faster than house rents especially in Sydney and Melbourne where rental conditions across the unit sector were previously much softer,” Mr Lawless says.
“The shift in rental demand towards units reflects both rental affordability pressures, which are deflecting more demand towards the ‘cheaper’ unit sector, and the return of overseas migrants and visitors. Rental demand from overseas arrivals tends to skew towards inner city and higher density precincts.”
In Sydney, unit rents were up 3.0% over the three months ending April, a full percentage point higher than the rise in house rents (2.0%). In Melbourne, the difference is starker, with unit rents 3.6% higher over the past three months compared with a 1.2% rise in house rents.
The rolling quarterly change in rents is now outpacing the rolling quarterly change in housing values across most of the capital cities, which is supporting a rise in gross rental yields. Nationally, housing values were up 1.9% over the most recent three month period, while rents increased 2.7%. The result is a subtle 2 basis point increase in the gross yield.
However, in Melbourne, the gross yield has lifted by 7 basis points from a recent low and Sydney gross yields are up 9 basis points from the recent low. Despite the upwards trend, gross yields in both these cities remain well below historic averages at just 2.5% and 2.8% respectively.
Higher yields and long-term prospects for capital growth could see investors comprising a larger portion of housing market activity. Financial aggregates published by the RBA to the end of March showed the monthly gain in investor credit growth was at the highest level since August 2015, with the speed of investment credit growth surpassing owner occupier credit for the first time since December 2016.
At a macro-level, housing market conditions have been easing since moving through a peak rate of growth in March last year. This slowing of growth coincided with rising fixed term mortgage rates, as well housing affordability progressively becoming more of a challenge, consumer sentiment trending lower and, from October last year, tighter serviceability testing for borrowers.
With the cash rate set to move through a rapid tightening cycle, we expect this trend towards a gradual softening in the growth rate will become more pronounced over the coming months, before the national index starts to trend lower. Mr Lawless says CoreLogic research shows a strong inverse relationship between movements in the cash rate and the rate of change in housing values.
“Although we are expecting the housing market to move into a downturn through the second half of the year, it is important to remember the context of the recent growth phase,” he says.
“Since the onset of the pandemic, national housing values have increased by 26.2%, adding approximately $155,380 to the median value of an Australian dwelling.”
The RBA recently noted a 2-percentage point rise in interest rates could lower housing prices by 15%. Under this scenario, which CoreLogic recently explored in detail, shows national dwelling values would be at a similar level to where they were in April 2021. Those who purchased a home over the past year will likely see the value of their home fall below the purchase price, but considering most borrowers were purchasing with a loan to valuation ratio of less than 80%, instances of negative equity are likely to be infrequent.
The extent of any housing market downturn depends on how high and how fast interest rates rise, but also a variety of other factors will be at play. Labour markets are currently showing the lowest unemployment rate since the mid-1970’s, and conditions are set to tighten further. Such a low unemployment rate, along with an expectation for higher income growth, should keep distressed listings at relatively low levels.
Additionally, as we enter a period of higher interest rates, borrowers are generally well ahead of their mortgage repayments. The RBA has recently noted in their latest financial stability review the median repayment buffer for owner occupiers with a variable mortgage rate had grown to 21 months of scheduled repayments in February 2022, up from 10 months at the start of the pandemic. Even with a two percentage point rise in mortgage rates, the median repayment buffer would reduce back to 19 months, which is still substantial. With the median household well ahead of their mortgage repayments, the risk of households falling behind on their mortgage repayments is reduced.
Mortgage distress should also be minimised to some extent by mortgage serviceability assessments at the time of the loan origination. All borrowers would have been assessed to repay their mortgage under a scenario of mortgage rates being 2.5 percentage points higher than the origination rate, and since October last year, borrowers were being assessed at mortgage rates of 3 percentage points higher.
Under these serviceability scenarios, borrowers should be able to accommodate higher mortgage repayments costs, although such as rapid rate of inflation could create some challenges for borrowers with thinly stretched budgets.
Access to the Home Value Index is free and available to download here.

Meet Tim Lawless
Executive, Research Director, Asia-Pacific
Tim is executive research director of CoreLogic’s Asia–Pacific research division, managing a team of economic and data specialists across Australia and New Zealand. He brings more than 20 years’ experience to the role, providing deep insights and analysis on national housing trends.
Full profile