CoreLogic reported a further fall in housing values through the first month of spring, with the national Home Value Index (HVI) recording a -1.4% decline in September. Although values continue to trend lower, the rate of decline eased from a -1.6% fall in August.
The loss of momentum in the pace of value decline was evident across most of the capital cities and broad rest-of-state regions, with a few exceptions. Housing value falls accelerated in Adelaide and Perth this month, however both cities continue to record only a mild reduction in values relative to the other capitals (down -0.2% and -0.4% respectively in September). Sydney’s monthly rate of decline eased from -2.3% in August to -1.8% in September, Melbourne tapered from -1.2% to -1.1% and Brisbane falls went from -1.8% to -1.7%. Darwin remains the only capital city where housing values haven’t started to trend lower, although dwelling values remain -10.1% below the 2014 peak.
According to CoreLogic’s research director, Tim Lawless, it is probably too early to suggest the housing market has moved through the worst of the downturn. “It’s possible we have seen the initial shock of a rapid rise in interest rates pass through the market and most borrowers and prospective home buyers have now ‘priced in’ further rate hikes. However, if interest rates continue to rise as rapidly as they have since May, we could see the rate of decline in housing values accelerate once again.”
The reduction in the rate of decline came alongside an improvement in other indicators. “Auction clearance rates also trended upwards, albeit subtly, in September and consumer sentiment nudged a little higher as well on the back of strong labour market conditions,” Mr Lawless said. “We’ve also seen the flow of fresh listings continue to slide through the first month of spring, which is uncommon for this time of the year.”
After rising 25.5% over the recent growth cycle, housing values across the combined capitals index are now -5.5% below the recent peak, or in dollar terms, down approximately -$46,100. The combined regionals index, which recorded stronger growth conditions through the upswing (41.6%), peaked two months later than the capital cities (June 2022), with values down -3.6% through to the end of September (approximately -$21,700).
Although the rate of decline eased in September, Sydney continues to record the largest falls, with housing values now -9.0% or -$104,300 below the city’s January 2022 peak. After a later peak and subsequent start to its slide, Brisbane has almost caught up with Sydney’s monthly rate of decline, to be -4.3% / -$33,600 below its June 2022 peak.
Most cities continue to see a substantial buffer between current housing values and where they were at the onset of COVID in March 2020. At the combined capital city level, housing values would need to fall a further -13.5% before wiping out the gains of the recent growth cycle, while Melbourne, which saw a softer upswing than other regions (+17.3% from trough to peak), would only need to see a -4.3% fall in values before returning to pre-COVID levels.
Across the 307 SA3 sub-regions analysed nationally (excluding areas with low sales or low confidence scores), only 25 regions remained at record highs at the end of September.
“We are still seeing some resilience to value falls around the more affordable areas of Adelaide and Perth, as well as some regional markets associated with agriculture, mining and tourism,” Mr Lawless said.
The largest cumulative falls have been concentrated in areas of Sydney’s Northern Beaches, including the SA3’s of Warringah, Pittwater and Manly where housing values are down at least -14.5% since moving through a peak in early 2022, as well as flood affected areas across Richmond - Tweed.
“These areas saw housing values rise between 38% and 62% through the growth cycle, so most home owners are still well ahead in terms of equity in their home,” Mr Lawless said.
At a time when the flow of new listings is typically ramping up, the ‘spring selling season’ is off to a slow start in Australia. The number of new listings added to capital city housing markets over the four weeks ending September 25th was -12% lower than the same period a year ago and -10% below the previous five-year average. Darwin and Canberra are the only exceptions, with both cities recording a higher than average flow of new listings over the past four weeks.
“It seems prospective vendors are prepared to wait out the housing downturn, rather than try to sell under more challenging market conditions,” Mr Lawless said. “We haven’t seeing any evidence of distressed sales or panicked selling through the downturn to date; in fact, it has been the opposite, with the trend in newly listed properties continuing to diminish at a time when freshly advertised stock levels would normally be moving through a seasonal ramp up.”
The reduced flow of new listings to the market could be a key factor helping to keep a floor under larger price falls, supporting the subtle reduction in the rate of decline through September.
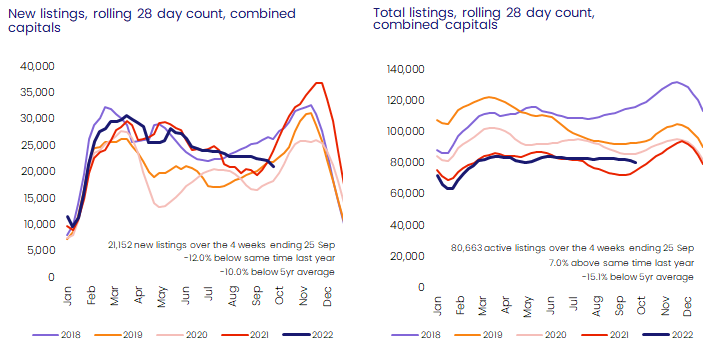
While the flow of new listings is seasonally low, total advertised inventory is holding firm or rising in most regions. Across the combined capitals, total advertised stock levels are tracking 7% higher than the same time last year, but are still -15% below the previous five-year average. In some of the weaker cities, total advertised stock levels have risen to above average levels, including Sydney (1.1% above the previous five-year average), Melbourne (+9.7%) and Hobart (+9.0%). Total stock levels are trending lower in Adelaide and Perth, where advertised supply is still more than a third below the previous five-year average.
Higher than average total stock levels in some cities is more a reflection of less demand than too much supply being added to the market. Capital city sales activity through the September quarter was estimated to be -12.2% lower than a year ago, but still 6.5% above the previous five-year average for this time of the year. Although most regions are recording less sales activity than a year ago, Adelaide (+18.5%), Perth (+5.0%) and Darwin (+4.8%) each recorded more sales over the past three months compared to the same period last year. Sydney and Hobart were the only capital cities to record a lower quarterly volume of sales than the previous five-year average.
Download the September Home Value Index

Meet Tim Lawless
Executive, Research Director, Asia-Pacific
Tim is executive research director of CoreLogic’s Asia–Pacific research division, managing a team of economic and data specialists across Australia and New Zealand. He brings more than 20 years’ experience to the role, providing deep insights and analysis on national housing trends.
Full profile