CoreLogic Research team’s Monthly Chart Pack provides a detailed overview of key market metrics including the combined value of residential real estate, sales volumes and dwelling values. Catch up on everything that happened in July.
- The combined value of residential real estate in Australia fell to $9.8 trillion at the end of July, down from $9.95 trillion in the previous month.
- Dwelling values in Australia are 8.0% higher over the past 12 months, down from a cyclical peak of 22.4% recorded in the 12 months to January 2022.
- Through the month of July, five of the eight capital cities saw a decline in dwelling values, while growth rates slowed in the remaining three cities.
- The highest annual growth rate in dwelling values among the regional and capital city dwelling markets was across Adelaide, at 24.1%. The lowest rate of appreciation in values was across Melbourne, which rose just 0.3% over the year.
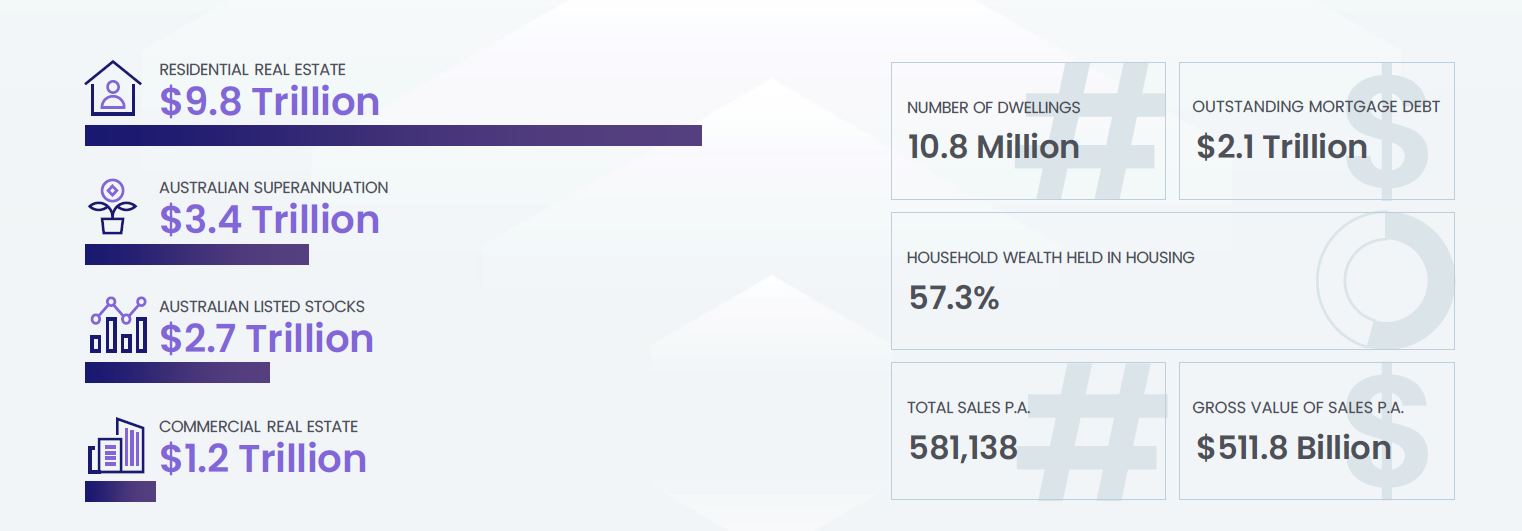
- Sales volumes are starting to ease from recent highs. CoreLogic estimates that in the 12 months to July, there were 581,138 sales nationally. This was relatively steady compared to the previous year. While up annually, initial sales estimates over the three months to July were -16.0% lower than the same quarter of the previous year.
- At the national level, properties are taking longer to sell. In the three months to July, the median days on market was 32, up from a recent low of 20 days over the three months to November.
- Similarly, vendor discounting has also increased from the recent low of -2.8% recorded in the three months to April last year. In the three months to July, the median vendor discount at the national level was -3.8%.
- In the four weeks to July 31, there were 35,458 newly advertised dwellings listed for sale nationally. In recent weeks, the flow of new listings has seen a seasonal slowdown, but is still higher than the five-year average for this time of year. At the national level, total listings are gradually rising, but remain well below the average for this time of the year. Total stock levels remain -24.8% below the five-year average.
- The combined capital cities clearance rate continued to trend lower through July, averaging 53.5% in the four weeks to July 31st. This is down from 74.4% in the equivalent period of 2021.
- Rent values continued to climb 0.9% in the month of July, marking the sixth consecutive month that growth in rent values has been higher than growth in home values. Australian rents are now 9.8% higher over the year to July.
- Lending for property purchases fell -4.4% over the month of June. Each borrower segment saw a decline in value, with investor lending falling by -6.3%, and owner occupier lending down -3.3%. First homebuyer lending declined -10.0% in the month.
- In June, the average long-term fixed rate was 4.54% for new owner occupier loans, and 4.73% for new investor loans. Average new variable rates were 149 basis points lower than long-term fixed rates for new owner occupier borrowers through June.
Download the Monthly Housing Chart Pack
CoreLogic Australia