Each month the CoreLogic Research team puts together a Chart Pack, providing a comprehensive overview of key market metrics such as the combined value of residential real estate, sales volumes the trend in new listings. Here's what happened in September.
- The combined value of residential real estate in Australia fell to $9.6 trillion at the end of September, down from $9.7 trillion in the previous month.
- Dwelling values across Australia are 1.7% higher than they were this time last year, down significantly from a cyclical peak of 22.4% recorded in the 12 months to January 2022.
- While the housing market downswing has become more broad-based, the monthly rate of decline slowed to -1.4% in September, from -1.6% through August.
- The highest annual growth rate in dwelling values among the regional and capital city dwelling markets was across Regional SA, at 22.2%. The lowest rate of change in values was across Sydney, down -6.0% over the year.
- The rolling 28-day change in the combined capitals home value index fell a further
-1.3% through the 28 days ending September 30th.
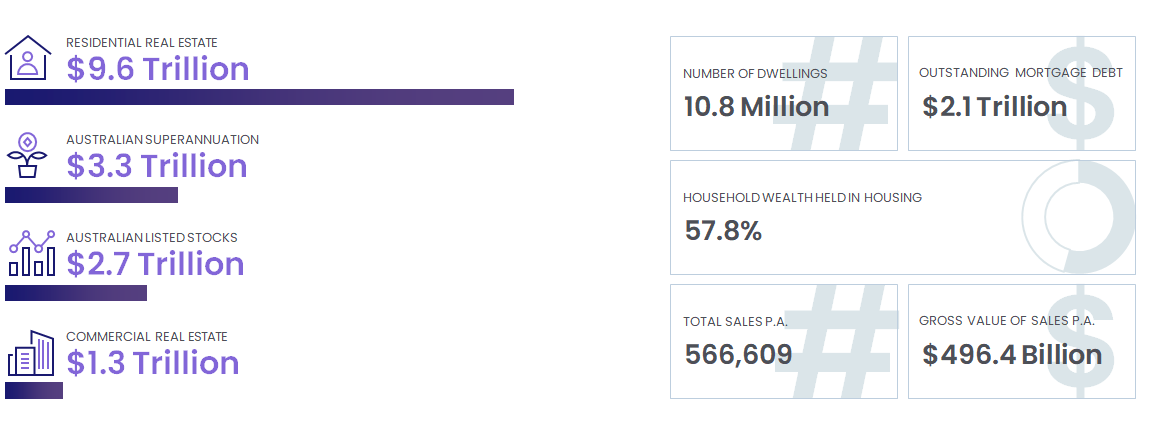
- Sales volumes are trending lower as buyer demand slows. CoreLogic estimates that in the 12 months to September, there were 566,609 sales nationally, down -5.2% compared to the previous year.
- At the national level, properties are taking longer to sell. In the three months to September, the median days on market was 35, up from a recent low of 20 days over the three months to November.
- Similarly, vendor discounting has also increased from the recent low of -2.9% recorded in the three months to November last year. In the three months to September, the median vendor discount at the national level was -4.2%.
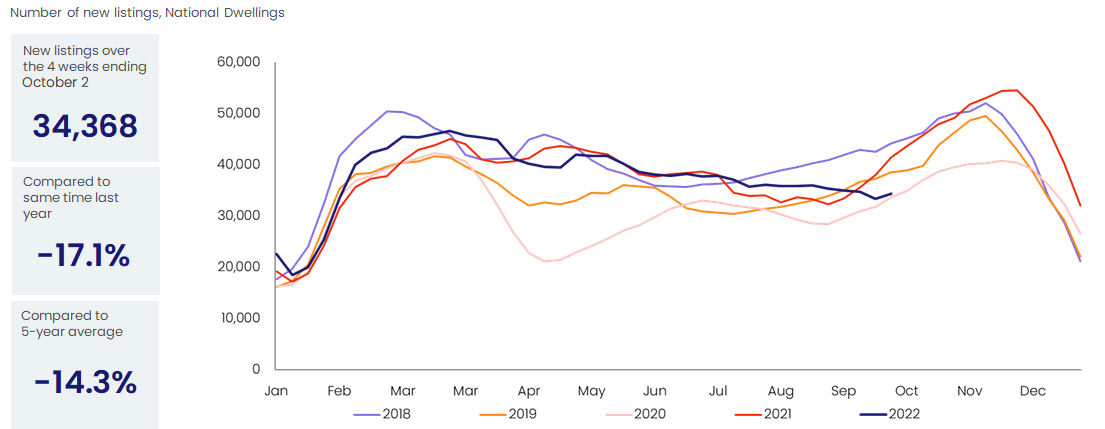
- In the four weeks to October 2, there were 34,368 newly advertised dwellings listed for sale nationally. While the volume of new listings has ticked up slightly compared to the 28 days to 29th September, the flow of new listings is -14.3% lower than the previous five-year average.
- The combined capital cities clearance rate trended higher through September, averaging 59.8% in the five weeks to September 25th. While up from the average recorded over August (56.8%), it is down from 74.3% in the equivalent period of 2021.
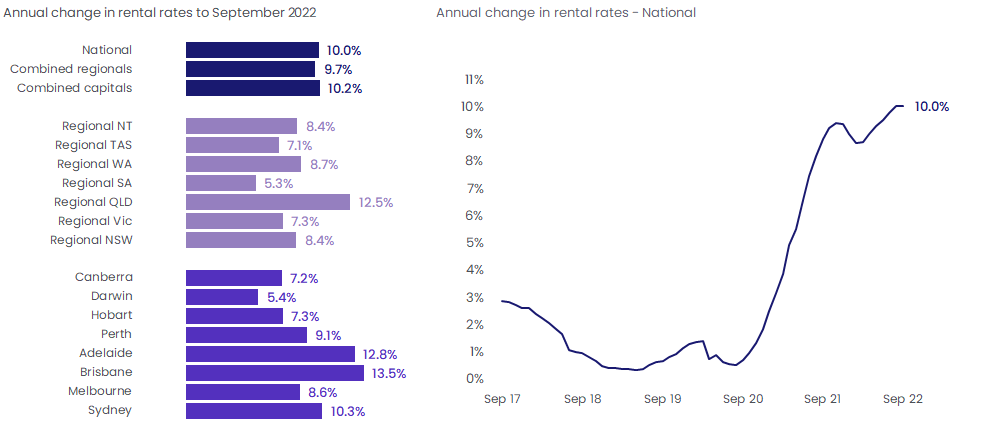
- Rental value growth remains high across Australian dwellings, but the annual growth in house rents has shown signs of moderating growth, falling to 9.4% in the 12 months to September. Unit rent values have seen increased momentum, rising 11.8% over the past year. This saw annual rental growth across national dwelling hold steady at of 10.0%.
- Through September, Australian gross rent yields rose to 3.57%, up from a recent low of 3.21% in February this year. Since the end of 2021, gross rent yields in Sydney have lifted 51 basis points, and 35 basis points in Melbourne.
- Through August, unit dwelling approvals virtually doubled on the previous month, taking total approvals 28.1% higher across houses and units. Despite the rise, monthly unit approvals remained below the decade average of 7,456.
- The RBA lifted rates to 2.60% in October. This takes the cash rate target slightly higher than the pre-COVID decade average, which was 2.55%.
Download the latest Monthly Housing Chart Pack.

Meet Eliza Owen
Head of Residential Research Australia
Eliza Owen was appointed the Head of Research at CoreLogic Australia in 2020.
Full profile