Patience is a virtue, particularly when it comes to Australian’s penchant for residential property. The short-term trends may be the talk at a weekend barbecue and in the media, but Australians tend to hold their homes a lot longer than a typical market cycle.
For some context, Australia’s median hold period (ie the number of years between individual home sales) was nine years for homes sold over the past 12 months.
Through the peak of the latest growth cycle, approximately 617,300 homes were sold across Australia, the largest number of sales since 2003, but that equates to only 6.3% of Australian dwellings turning over in a year, highlighting that most home owners aren’t directly impacted by changing values.
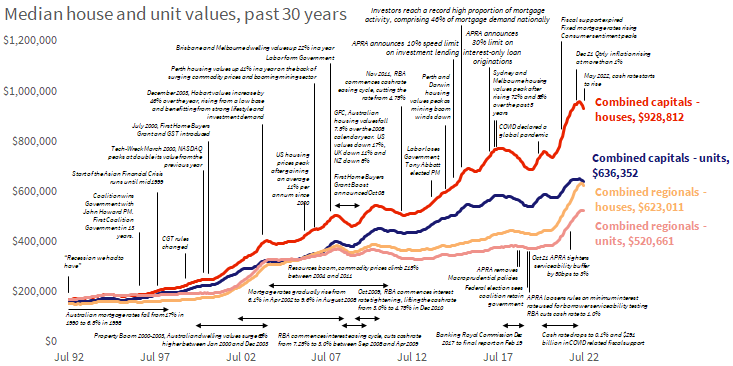
Given the focus on the surge in housing values through the pandemic, and the more recent weakening in home value trends as interest rates rise, it’s worthwhile providing a refresher on how significantly housing values have changed over time, specifically the past three decades.
Over that 30-year period we have seen six distinct cycles of growth and an equal number of cycles of decline (including the current downswing) across the national index. Each of the upswings and downturns have been characterised by different environments and catalysts of change such as taxation policy, monetary policy decisions, economic shocks, fiscal stimulus and broader economic conditions.
While housing values move through cycles of growth as well as declines, the long-term trend is undeniably upwards. Nationally, dwelling values have increased 382% over the past 30 years, or in annual compounding terms, rising by 5.4% on average since July 1992.
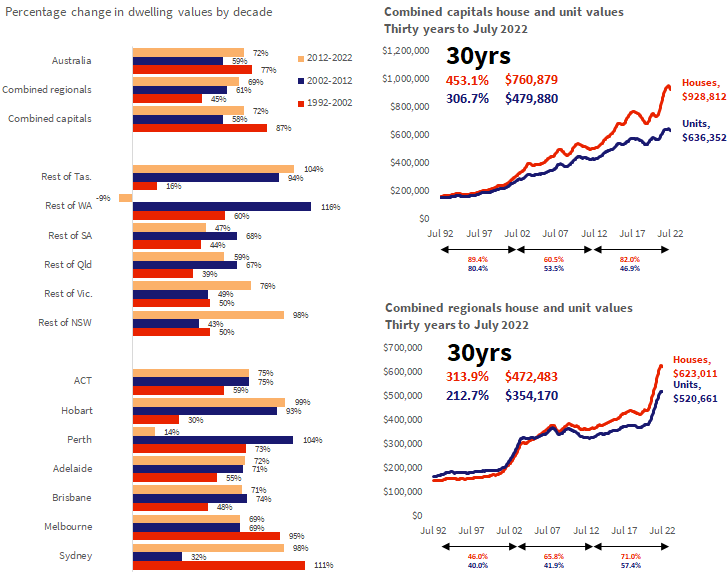
Across each of the past three decades, at a macro level, it was the 1992-2002 period that provided the largest capital gains, with CoreLogic’s national Home Value Index (HVI) rising by 77%. The middle decade (2002-2012) saw the national HVI rise by 59%, while the most recent decade has seen national dwelling values increase by 72%.
However, between regions there have been substantial differences depending on local market dynamics. For example, the mining boom and subsequent bust in WA saw Perth housing values rise by 104% between 2002 and 2012, but today’s values are only 14% higher over the current decade (2012-2022). In Hobart, the 1992-2002 period was the weakest of the three decades analysed, with values up 30%, while the most recent 10 years has seen Hobart housing values surge 99% on the back of stronger migration and an ongoing undersupply of housing.
Overall, the long-term trends highlight the cyclical nature of housing markets. Changes in housing values over decades are a clear reminder that time in the market is more important than timing the market.
Dispelling a long held housing myth, it’s actually rare for housing values to double in 10 years. Over the past decade, none of the capitals and only one regional market (Regional Tasmania) recorded a growth rate of 100% or higher. In the previous 2002-2012 decade it was only Perth and Darwin where housing values doubled.
Most regions have seen house values rise substantially more than unit values over the past 30 years, which is likely a reflection of the scarcity value of land driving a faster rate of appreciation. Conversely, the unit sector tends to show higher yields relative to houses. Across the combined capital cities, house values are up 453% over the past 30 years, substantially higher relative to the unit sector where values are 307% higher.
The performance gap is less substantial across the combined regional markets, with house values up 314% since 1992 compared with a 213% rise in unit values. The smaller long-term rate of capital gain might be attributable to lower unit supply levels across regional Australia, along with higher demand for holiday style units or retirement options.
Capital cities have recorded a higher growth rate than the regional areas of Australia over the past 30 years, with dwelling values rising by 409% and 294% respectively across each of the combined capital city and rest of state regions.
The higher growth rate across the capital cities probably reflects a combination of higher demand and greater scarcity of supply compared with regional markets, along with more diversified economic conditions within the capital cities.
Highest 30-year growth rate
Capitals: Melbourne +459% (5.9% per annum)
Regionals: Regional Tasmania +361% (5.2% per annum)
Lowest 30-year growth rate
Capitals: Perth +303% (4.8% per annum)
Regionals: Regional WA +214% (3.9% per annum)
The importance of short-term v long-term cycles
With 57% of household wealth held in housing, it’s understandable that Australian’s will be interested in the shorter term ups and downs of the housing sector. However, residential property is rarely ‘traded’ like equities; housing is illiquid and comes with extremely high transactional costs such as stamp duty, conveyancing costs, and expenses associated with due diligence, along with long settlement periods and a high financial commitment.
For home owners, changes in property values will have an influence on the equity they hold in their property, which can be used to leverage into other purchases or investments. Higher debt to asset value ratios can have a negative impact on borrowing capacity. Additionally, higher housing values generally translate to increased wealth and a greater willingness from households to spend.
A more direct impact from short-term changes in housing market conditions are felt by the small proportion of households that are considering a property purchase or sale; from year to year only 4-6% of properties are transacted. A housing downturn may be seen as a positive outcome for prospective buyers, but viewed from a negative perspective for those looking to sell, although selling in a market downturn could be an opportunity if the seller is re-buying.
How the long-term cycles evolves from here is open for debate
Forecasting where housing trends are going is hard enough over the short-term, let alone over the next 10, 20 or 30 years. However, the long-term cycles can teach us a few things about the future of the market:
The decline trend we are seeing at the moment will eventually level out, typically followed by a period of stability then further growth. Analysing each downturn across the combined capitals from the early 1980’s shows the longest period of falling values has been 21 months, recorded over the most recent down phase (2017-2019) and also through the 1989-91 downturn.
For those that believe housing values double every 10 years, you might need to think again. None of the capital cities recorded a doubling in dwelling values over the past 10 years (the closest was Sydney at 97.6% growth), and over the previous decade (2002-2012) Perth and Darwin were the only capital cities to double in value with gains of 103.8% and 105.5% respectively. For those looking to double the value of their asset over a decade they will need to be outperforming the broader average.
Download the full 30-year analysis to learn:
- 30-year growth rate for each capital city
- The best performing capital city sub-regions
- Highest growth regions over the past three decades
- Top 20 capital city SA3 regions
- Change in values
- Change in dollar values

Meet Tim Lawless
Executive, Research Director, Asia-Pacific
Tim is executive research director of CoreLogic’s Asia–Pacific research division, managing a team of economic and data specialists across Australia and New Zealand. He brings more than 20 years’ experience to the role, providing deep insights and analysis on national housing trends.
Full profile