As household balance sheets become more thinly stretched due to rising interest rates and high prices for essential goods such as fuel and food, there is a renewed level of focus on how mortgagors (ie home owners with mortgage debt) are traversing the changing environment.
Policy makers and lenders will be watchful for any signs of distress across the housing sector. One of the first signals of mortgagor distress could be an out of cycle rise in the number of homes being added to the market.
So far the trend in new listings across Australia has generally followed ‘normal’ seasonal patterns, with no evidence of panicked selling or a rise in distressed stock coming on the market. The flow of new listings is generally in line with last year and showing little divergence from the pre-COVID average at the macro level.
Nationally, the flow of new listings added to the market has been reducing since late March, when 46,603 houses and units were newly listed over the four-week period ending March 20th. Since that time the four-week count of new listings has trended lower, with CoreLogic recording 37,476 ‘fresh’ listings over the most recent four-week period ending July 17th; 19.6% lower than the March 20th high and 1.4% fewer properties relative to the same time a year ago, but 1.5% above the pre-COVID average (which includes the ten-year period prior to 2020).
Importantly, the impact of COVID related restrictions can influence year-on-year comparisons, especially in cities like Melbourne and Sydney where more frequent outbreaks occurred. It’s why the pre-COVID average is also a useful benchmark.
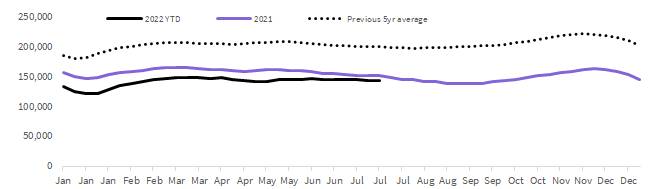
While the flow of fresh stock added to the market has trended lower, the total count of listings has held relatively firm, reducing from a recent peak of 149,327 over the four weeks ending March 20th to the most recent count of 144,222 (a reduction of 3.4%).
The relatively steady number of total listings amidst a sharper reduction in fresh listings highlights a slower rate of absorption across the market. Through the June quarter, the number of home sales was estimated to be 15.9% lower than a year ago, reflecting less buyer demand. The slower rate of absorption is likely to worsen as rapidly rising interest rates and low confidence dampens buyer activity further, suggesting even as new listings trend lower through winter, total advertised supply is likely to rise through the second half of the year.
While the national trends provide a macro context, the trend in listings is remarkably diverse across the capital cities and regional markets of Australia.
Regions where housing values have been trending lower, including Sydney and Melbourne, are showing a more obvious reduction in new listings, but these are also the two capital cities where total advertised stock is now trending at levels above the pre-COVID average.
Conversely, stronger markets like Adelaide and Perth are seeing a relatively steady trend in new listings, but overall stock levels remain well below average with no evidence that advertised supply is starting to rise.
Figure 1 – National new listings trend
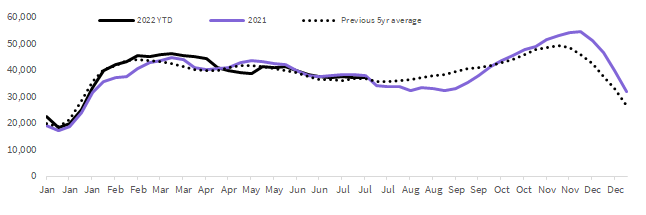
Figure 2 – National total listings trend
Seasonal trends
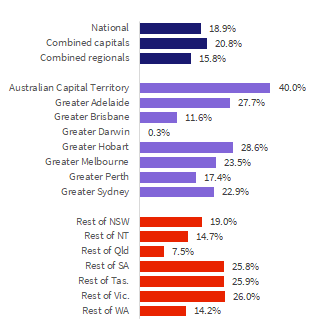
The flow of listings is highly seasonal, with the winter months typically seeing new listings trending lower before ramping up swiftly in spring. Nationally, the number of new listings has typically fallen by 9.2% between autumn and winter (based on the pre-COVID average) before surging 18.9% between winter and spring.
The seasonality of the flow of new listings between winter and spring is most obvious across the ‘colder’ states. ACT listings surge by an average of 40% between winter and spring, while Hobart, Adelaide, Melbourne and Sydney also see more than a 20% difference between the winter and spring seasons.
However in ‘hotter’ regions the trend is less obvious. Darwin is the prime example, with hardly any difference in the average flow of new listings, but new listings drop on average by 35% leading into the wet summer months, with autumn being the most active period for new listings.
Figure 3 – Percentage change in average number of new listings between winter and spring (based on the pre-COVID average)
Nationally, new listings have risen by an average of 18.9% between winter and spring, with the peak listing month being October, followed closely by November. The seasonal rise in new listings through spring and early summer is likely to test the market this year.
With housing demand already trending lower, as demonstrated by fewer home sales across some regions, it’s likely overall advertised supply levels will rise more substantially through the final quarter of the year and into 2023.
Higher levels of advertised supply implies more choice for buyers but also more competition for vendors. Ultimately, higher inventory levels would likely add further dampening pressure on housing values as homes take longer to sell, motivating vendors to discount their pricing expectations by a larger amount.
We can already see this scenario playing out in lower clearance rates, higher time on market and larger rates of vendor discounting, although there is a significant level of variability from region to region depending on the balance between buyers and sellers.
Median days on market in Sydney increased to 33 days through the June quarter (from 23 days a year ago) and Melbourne median days on market has increased from 27 days a year ago to 30 days through the June quarter. At the other end of the spectrum, Perth homes are selling in an average of just 18 days, equal to the median days on market last year.
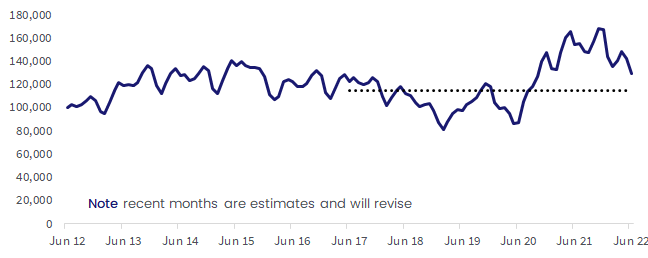
Figure 4 – Rolling three months volume of sales, National
The complete Property Pulse for 28 July 2022, including league tables where advertised supply is the highest and lowest relative to pre-COVID average levels can be downloaded below.

Meet Tim Lawless
Executive, Research Director, Asia-Pacific
Tim is executive research director of CoreLogic’s Asia–Pacific research division, managing a team of economic and data specialists across Australia and New Zealand. He brings more than 20 years’ experience to the role, providing deep insights and analysis on national housing trends.
Full profile