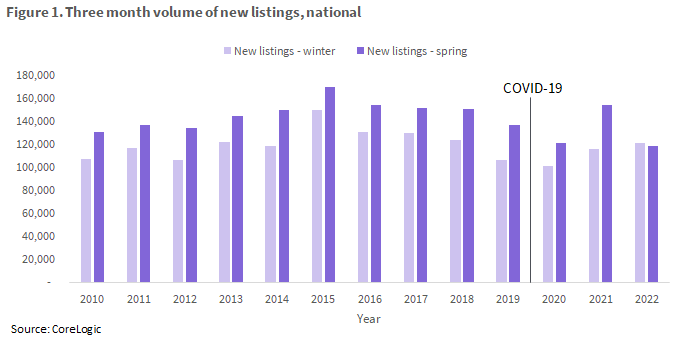
Spring time typically draws out buyers and sellers of real estate in Australia, with longer daylight hours, fine weather and lush gardens enhancing the look and feel of properties.
For a decade prior to the pandemic, there was an average uplift of 21% in new listings nationally between winter and spring. New listings hitting the market have gone from an average of around 123,000 through winter, to 146,000 through spring. 2022 is different. Spring came and went without the usual surge in listings. Instead of new listing campaigns rising from winter to spring, freshly listed properties fell nationally for the first time in at least 12 years. New listings added to the market in the three months to November totalled 118,734, down from 121,859 in the three months to August.
What made 2022 such a lacklustre spring selling season?
Property values have declined. Vendors may have chosen not to list their property in the past few months because prices have deteriorated from a peak in April. Amid the fastest rate-tightening cycle since the 1990s, home values declined -7% from April through to the end of November. This is the steepest decline in home values on record, and represents an equivalent fall of around $53,000 in the national median home value.
Selling conditions have changed in favour of buyers. In the three months to November 2021, the median amount of time a listing was on the market before selling was a mere 20 days. This has increased 35 days in the same period of 2022. Similarly, vendor discounts from the initial listing price have also deepened, from -2.9% in the three months to 2021, to -4.3% in the spring of 2022.
So long as mortgage holders can afford their repayments, and do not need to move, sellers may be less and less motivated to put their property on the market at the moment. This is reflected in previous research from CoreLogic, which shows a positive correlation between capital growth and new listings volumes.
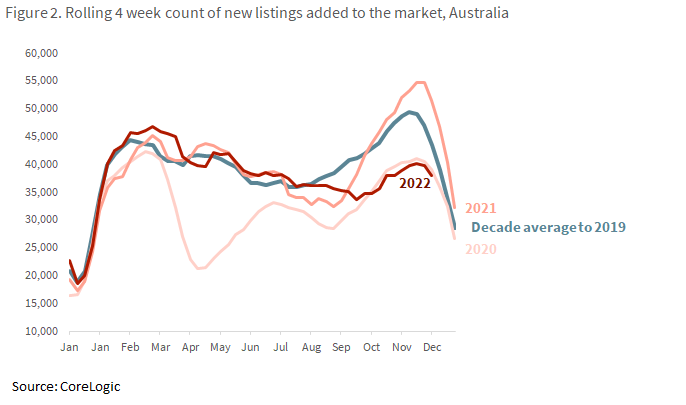
Many buying and selling decisions were made last year. 2022 was not the only strange year for the spring selling season. COVID-19 warped the spring selling season of 2021, with record-low interest rates creating a buying frenzy. There was likely also an element of ‘catch up’ at play, with extended lockdowns across Melbourne and Sydney putting a dampener on transaction activity through 2020 and 2021.
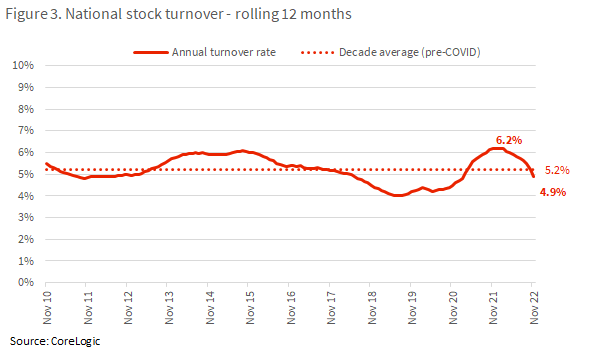
Last year, listing activity surged 33.1% on winter, and the spring selling season extended well into summer. Weekly auction volumes across the capital cities peaked at a record high 4,981 in the week ending December 12th. Over the year of 2021, there were around 620,000 sales (above a pre-COVID decade average of around 470,000). Given an unusually high volume of properties transacted last year, this may have had a slight vacuum effect on buying and selling decisions in 2022.
Which markets had the best / worst spring selling season compared to previous years?
The tables below show the local government areas (LGA’s) across the combined capital cities with the largest and smallest change between the spring selling season of 2022, and an historic average.
Of the 140 markets analysed, only 11 markets saw more new listings come to market this year than the decade prior. Interestingly, the ACT is included here, where new listings volumes have been much more steady on previous years despite dwelling market values declining -6.5% from a peak in June. Listings activity in the ACT may not have responded as strongly to recent price falls, given values are still around 29% higher than they were at the onset of COVID-19.
Other markets where new listings are substantially higher this year than over the past spring periods are generally markets where prices have been unaffected by the rising rate environment, and selling conditions are strong. These are generally markets in Perth and Darwin.
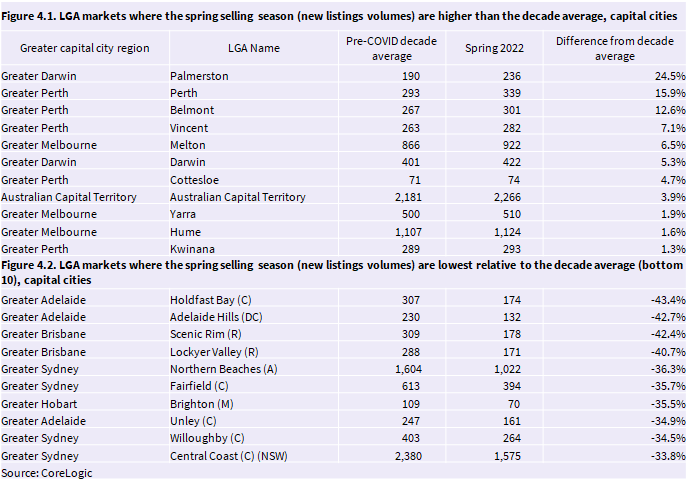
Table 4.2 shows the markets where new listings volumes through spring have declined most substantially on the historic average. This ranged between a -43.4% drop in new listings across Holdfast Bay, and a drop of around a third across the Central Coast. The list represents markets that have generally seen steeper price declines since the start of 2022. Some of these markets also had a particularly strong selling period through COVID, including lifestyle markets like the Central Coast and the northern beaches.
Where to from here?
The policy response amid the pandemic from governments and the RBA has produced extraordinary fluctuations across a range of economic activity. Extreme shifts have played out across retail spending, household savings, consumer sentiment and the housing market. The rise and fall of the spring selling season is just one of many market metrics showing a strong reaction to adjustments in the cash rate.

Meet Eliza Owen
Head of Residential Research Australia
Eliza Owen was appointed the Head of Research at CoreLogic Australia in 2020.
Full profile