Brisbane’s property market has set a new performance benchmark for the largest and fastest decline on record, barely seven months after values hit their peak.
Following a pandemic population surge and increase in values of more than 43%, Greater Brisbane home values hit a record high on 19 June 2022, soon after the Reserve Bank of Australia (RBA) commenced its rate-tightening cycle.
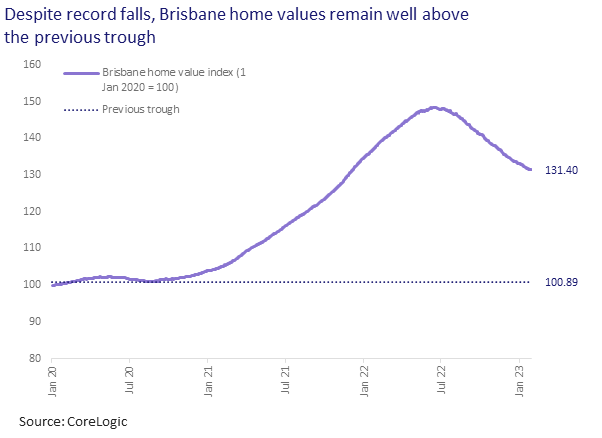
However, CoreLogic’s Daily Home Value Index (HVI) shows Brisbane’s home values declined 10.9% between the peak in June and 28 January, the largest percentage fall on record.
CoreLogic Head of Research Eliza Owen said the new benchmark follows hot on the heels of the national index’s record decline of 8.6%, which occurred on the 7 January, 2023.
“Brisbane now stands out as one of two capital city markets with record declines, the other being Hobart. Sydney continues to have the largest peak-to-trough falls of the capital city markets (currently at -13.8%), while peak-to-tough falls remain mild in some cities (such as Perth, where values are down just -1.0% from a recent peak in August 2022),” she said.
“The record fall in Brisbane home values has not made much of a dent in the gains made during the upswing. The fall in the Brisbane daily HVI follows an upswing of 43.5% between August 2020 and 19 June 2022, which was the fastest trajectory of rising values on record. This leaves home values across Brisbane 27.9% higher than at the previous trough in August 2020.”
How does this compare historically?
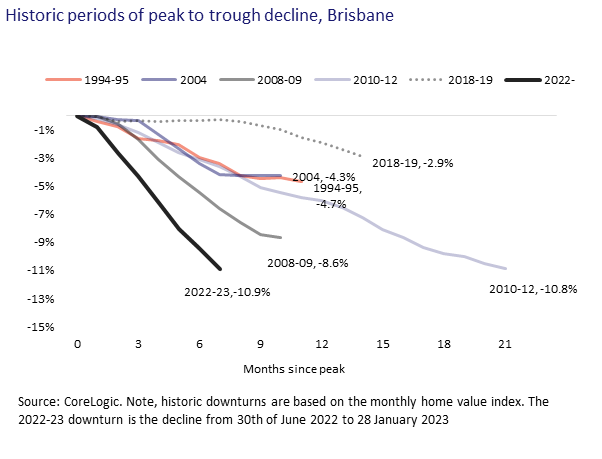
The -10.9% decline in Brisbane home values has taken just over seven months, making this both the largest and quickest decline in the Brisbane HVI so far. On average, peak-to-trough declines in the Brisbane dwelling market have lasted 14 months, and the extent of declines have ranged from -2.9% to -10.8%.
Ms Owen said the second largest downturn in Brisbane home values historically took place between April 2010 and January 2012, and took 21 months to reach a similar decline with the current downturn.
“The second largest period coincided with a national housing market downturn that was fairly broad based, and partly coincided with the RBA lifting the cash rate 175 basis points between October 2009 and November 2010,” she said.
“Cash rate rises occurred as Australia’s economy proved relatively resilient through the Global Financial Crisis (GFC), and the RBA moved to gradually repeal monetary stimulus it had put in place through 2008-09. Through this period, Brisbane saw the largest declines of the capital city markets.”
Notably, Ms Owen said there have been times when house and unit growth have varied across Brisbane.
One of the milder historic downturns in the market was between 2018 and 2019, where dwelling values overall declined -2.9%. However, below this headline figure, unit values had trended -6.8% lower between 2017 and 2019. The decline in unit values had been compounded by a surge in apartment development, resulting in an oversupply of newly built high-density housing stock. Temporary macro-prudential measures implemented between 2014 and 2017 and the later credit tightening associated with the Banking Royal Commission sharply curbed investor appetite for apartments.
Outlook for the Brisbane market
Ms Owen said Brisbane’s housing market is adjusting to a sharp increase in borrowing costs over the second half of 2022, which have likely hit buyers hard off the back of extraordinary price rises. The median dwelling value in Brisbane has increased from $506,553 at the onset of COVID-19 in March 2020, to $707,658 at the end of 2022.
“Despite the large decline from peak, Brisbane maintains the third highest gain in value of the capital cities since the start of the pandemic,” she said.
“Only Adelaide and Darwin, which are 42.8% and 29.6% higher respectively than at the onset of the pandemic, have performed stronger. For this reason, there is marginal risk of negative equity for Brisbane homeowners, with the exception of very recent buyers, who purchased around the peak in June 2022 with less than a 20% deposit.”
However, she said some factors may be placing a floor under the market as the pace of price falls across Brisbane has been slowing in recent months.
“The first factor is relative affordability. Although housing values remain higher than pre-COVID levels, Brisbane retains a lower price point than Sydney, with a $435,170 difference in median house values and $280,749 difference in median unit values,” she said.
“The gap between Brisbane and Melbourne housing values is also significant, with a $119,697 gap between median house values and $97,692 difference in median unit values. This could encourage ongoing housing demand from those willing to migrate to the state, or own an interstate investment.”
Brisbane also continues to experience above average levels of interstate migration. Based on the most recent demographic data to the June 2022 quarter, migration into Queensland was tracking 63% above the decade average, with net interstate migration into Queensland by far the largest across the states and territories.
Rent values increased a further 13.4% in 2022, suggesting an underlying shortage of available housing across the city.
“Similarly, a low volume of listings persists, where the volume of advertised stock is trending almost 40% below the previous five-year average,” Ms Owen said.
“While Brisbane property values are likely to fall further in 2023, it is possible the rate of decline will continue to slow over the coming months.”
About Greater Brisbane and the Daily Index
‘Greater Brisbane’ is a Greater Capital City Statistical area defined by the ABS. The region extends from the NSW border in the south west, to Wrattens National Park in the north west. The Greater Brisbane region encompasses at least part of eight Local Government Areas; Brisbane, Ipswich, Lockyer Valley, Logan, Moreton Bay, Redland, Scenic Rim and Somerset.
The daily home value index measures the change in value of the Greater Brisbane dwelling market, by recalculating market values each day, accounting for changes to the composition of stock. More on the Home Value Index methodology can be found here.

Meet Eliza Owen
Head of Residential Research Australia
Eliza Owen was appointed the Head of Research at CoreLogic Australia in 2020.
Full profile