Each month the CoreLogic Research team puts together a Housing Chart Pack, with all the latest stats, facts and figures on the residential property market, such as the combined value of residential real estate, sales volumes, and the trend in new listings.
Here are this month's highlights*:
- The combined value of residential real estate in Australia rose to $9.4 trillion at the end of March, from $9.3 trillion in the previous month.
- Dwelling values in Australia are -8.0% lower over the past 12 months, the largest annual decline on record.
- Despite a large annual decline in home values, the monthly results saw national home values lift 0.6%, and capital city home values increased 0.8%.
- The highest annual growth rate in dwelling values among the regional and capital city dwelling markets was across Regional SA, at 13.3%. The lowest change in values was across Hobart, where home values declined -12.9% in the past year.
- The rolling 28-day change in the combined capitals home value index was 0.9% in the 28 days ending 6 April.
- Sales volumes trended slightly higher through March to an estimate of 44,124 in the month. On an annual basis, sales are -20.7% lower year-on-year.
- Capital city home values are taking longer to sell, with median days on market at 34. This is up from a low of 19 days in the three months to November 2021. Properties are taking notably longer to sell in regional Australia, with median days on market up to 50 in the three months to March.
- Median vendor discounting nationally has deepened to -4.2%, compared with -3.1% in the March quarter of 2022. However, capital city discounting rates have eased through 2023 to-date.
- In the four weeks to 2 April 2023, the volume of new listings totalled 36,464 nationally. New listings have now moved through a seasonal peak, and are likely to trend lower through the cooler months of the year before rising in spring.
- The combined capital cities clearance rate averaged 65.4% in the four weeks ending 2 April 2023. While this was a much stronger result than in the final weeks of 2022 (averaging 55.1%), the combined clearance rate average did drop slightly on the previous four week period (65.8%).
- Annual growth in rent values held steady on the previous month in March, at 10.1%. The most rapid annual rise is evident in unit rents across Sydney, Melbourne and Brisbane, where rents have increased around 15 to 18% annually.
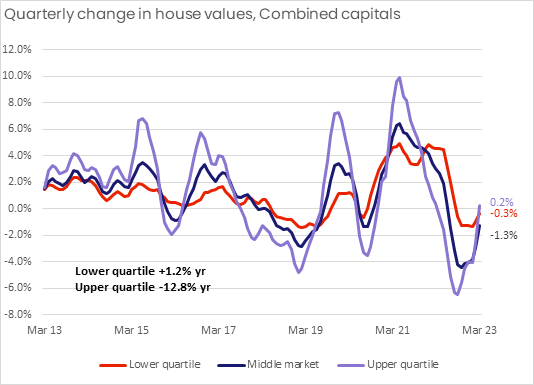
- The chart of the month shows the quarterly change in capital city house and unit values across different value tiers. An improvement in capital growth trends is most evident across the top 25% of home values.
*Data is to the end of March 2023 unless otherwise specified.
Download the Monthly Housing Chart Pack

Meet Eliza Owen
Head of Residential Research Australia
Eliza Owen was appointed the Head of Research at CoreLogic Australia in 2020.
Full profile