Each month the CoreLogic Research team puts together a Housing Chart Pack, with all the latest stats, facts and figures on the residential property market, such as the combined value of residential real estate, sales volumes, and the trend in new listings.
Here are this month's highlights*:
- National home values rose 2.3% in the three months to May. Quarterly growth has accelerated from 1.0% in the previous month.
- The combined capital cities dwelling market value rose 1.4% in May, following a 0.7% lift in April. Monthly increases across the combined capitals surpassed a 0.5% lift in the combined regional market over the month.
- The growth trajectory for housing across the combined capitals accelerated through May, though has eased slightly through the first week of June.
- The high end of the Sydney housing market continues to lead capital growth, up 5.6% for the three months to May.
- CoreLogic estimates there were 38,860 sales in May nationally. Volumes are trending closer to a historic monthly five-year average of around 40,000. However, sales volumes remain -21.5% lower year-on-year.
- The amount of time it takes to sell property is trending lower. Median days on market nationally is down to 33 in the three months to April. Capital city homes are selling in a median of 29 days, down from 33 days in the three months to February 2023.
- At the median level, vendors are now offering less of a discount on their property across the combined capital cities market. The median vendor discount across the combined capital cities has eased from -4.3% in the three months to October 2022, to -3.8% in the three months to May 2023.
- In the four weeks to 4 June 2023, the volume of new listings totalled 30,583 nationally. New listings have seen a seasonal descent in recent weeks, and remain -16.2% below the previous five-year average.
- Total listings are still markedly lower than the previous five-year average due to the relatively low volume of new selling decisions, against a normalising in sales volumes.
- The combined capital cities clearance rate rose strongly through the month, averaging 70.5% in the four weeks ending 28 May 2023. This is up from an average final clearance rate of 60.6% in the same period of 2022.
- Growth in rent values slowed to 9.9% in the 12 months to May. Growth in rents has slowed across smaller capital cities and regional Australia, while remaining strong in the larger capital cities.
- Gross rent yields came down over the month to 3.88%, the first monthly decline in national rent yields since January 2022. The decline in gross rent yields came amid capital growth outpacing rent value growth over the month.
- New housing finance secured totaled $23.3 billion in April, posting a monthly fall of -2.9%. The largest monthly fall in housing finance was across the owner occupier, non-first home buyer segment (-4.4%), followed by a -2.1% drop in first home buyer borrowing and a -0.9% decline in the investor segment.
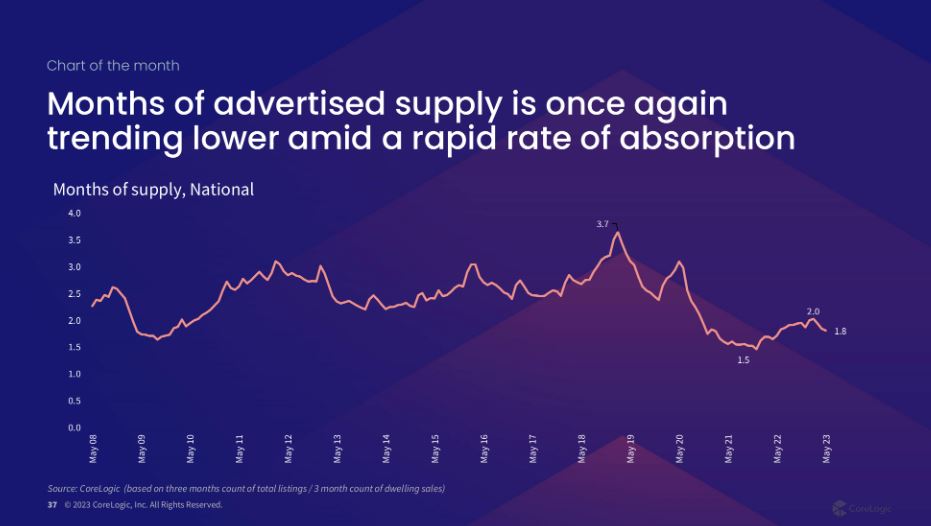
- The May ‘Chart of the Month’ uses modelled sales volumes and listings volumes to derive ‘months of supply’. Months of advertised supply is once again trending lower (to 1.8) amid a rapid rate of absorption from sales.
Download the Monthly Housing Chart Pack
*Data is to the end of May 2023 unless otherwise specified.

Meet Eliza Owen
Head of Residential Research Australia
Eliza Owen was appointed the Head of Research at CoreLogic Australia in 2020.
Full profile