Each month the CoreLogic Research team puts together a Housing Chart Pack, with all the latest stats, facts and figures on the residential property market, such as the combined value of residential real estate, sales volumes, and the trend in new listings.
Here are this month's highlights*:
- National home values rose 1% in the three months to April. This marks the first quarterly lift in home values since May 2022.
- The combined capital cities dwelling market value rose 0.7% in the month of April, following a 0.8% lift in March. This takes dwelling values 1.4% higher from a trough in February this year.
- The high end of the Sydney housing market is currently leading capital growth, up 4.0% for the three months to April.
- The number of sales trended seasonally lower through April, with CoreLogic estimating 35,398 sales in the month nationally. However, sales are fairly on-par with what is typically observed this time of year.
- The amount of time it takes to sell property is starting to pivot. Median days on market nationally is down to 33 in the three months to April. This has fallen from 37 days in the three months to February.
- At the median level, vendors are now offering less of a discount on their property across the combined capital cities market. The median vendor discount across the combined capital cities has eased from -4.35% in the September quarter of 2022, to -3.88% in the three months to April 2023.
- In the four weeks to 7 May 2023, the volume of new listings totalled 31,356 nationally. New listings have seen a slight uptick following a string of public holidays, but are likely to trend seasonally lower through the cooler months of the year.
- The combined capital cities clearance rate averaged 65.2% in the four weeks ending 30 April 2023. While this was a much stronger result than in the final weeks of 2022 (averaging 55.1%), the combined clearance rate average did drop slightly on the previous four-week period (65.4%).
- Annual growth in rent values held steady on the previous month, at 10.1%. Across the combined capital cities, rent values rose 11.7% in the past 12 months, which was the highest annual increase on record.
- Gross rent yields were fairly steady over the month at 3.9%, however yields have risen from 3.2% in the same month last year. Gross rent yields in April were highest in resource-based markets of Darwin, regional NT and regional WA.
- New housing finance secured totaled $24.0 billion in March, posting a strong monthly increase of 4.9% nationally. This is the first monthly rise since January last year, and follows more positive data flows on home values and sales volumes through March.
- The value of first home buyer finance rose 12.3% through March. First home buyer finance accounted for 24.7% of owner-occupier finance in the month, which is above the decade average of 23.7%.
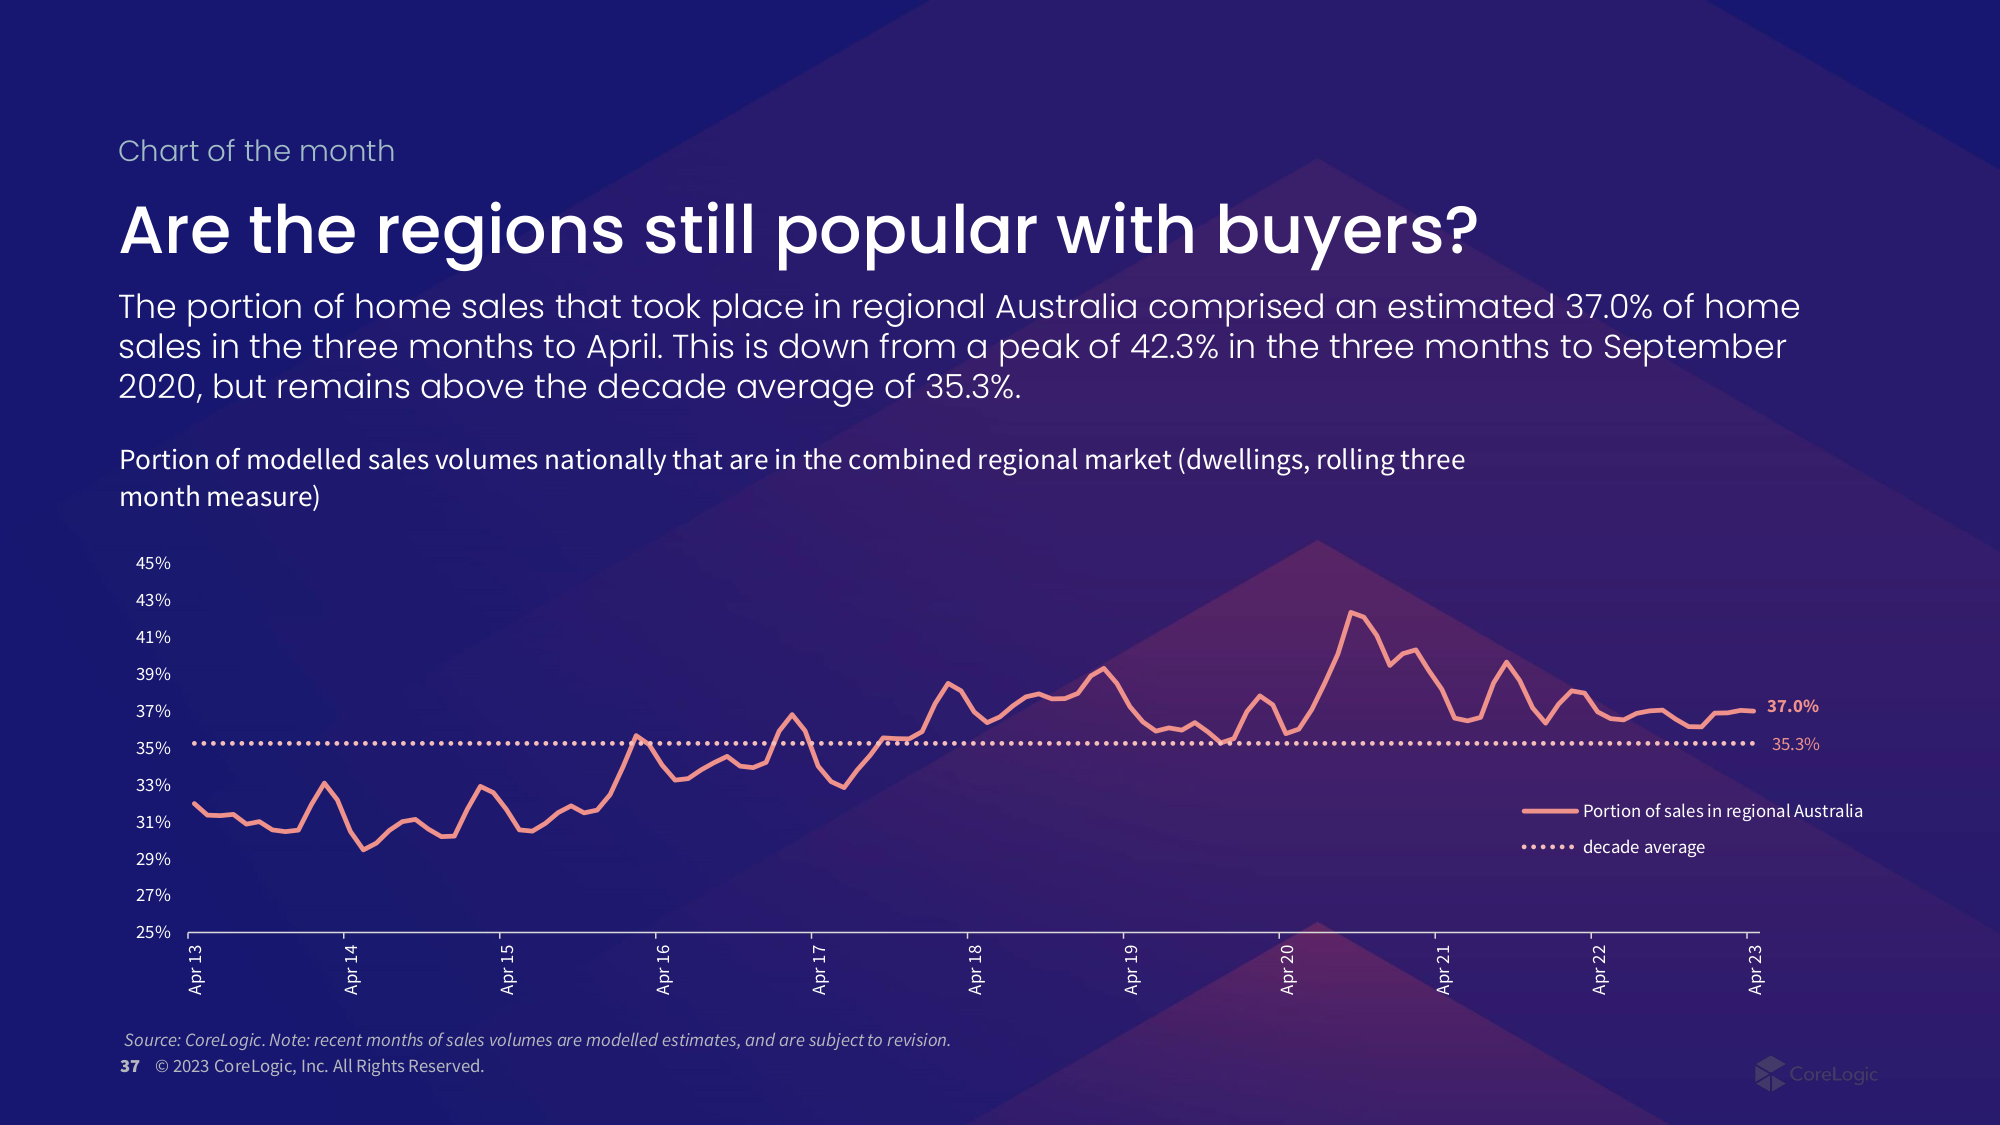
- Chart of the month: The portion of home sales that took place in regional Australia comprised an estimated 37.0% of home sales in the three months to April. This is down from a peak of 42.3% in the three months to September 2020, but remains above the decade average of 35.3%.
*Data is to the end of May 2023 unless otherwise specified.
Download the Monthly Housing Chart Pack

Meet Eliza Owen
Head of Residential Research Australia
Eliza Owen was appointed the Head of Research at CoreLogic Australia in 2020.
Full profile