In the past few weeks, several data sets have pointed to stronger demand for housing, as advertised supply remains low. We’ve seen this play out in:
- The combined capital city clearance rate, which has held above the decade average for six of the past eight weeks
- CoreLogic modelled sales volumes, which increased 10.4% through March
- Vendor discounting, which appears to have passed through a trough of -4.4% in the December 2022 quarter, to -4.2% in the March 2023 quarter
The result is that home values are starting to trend higher, as seen in CoreLogic’s national daily Home Value Index, which has lifted 0.9% since early March.
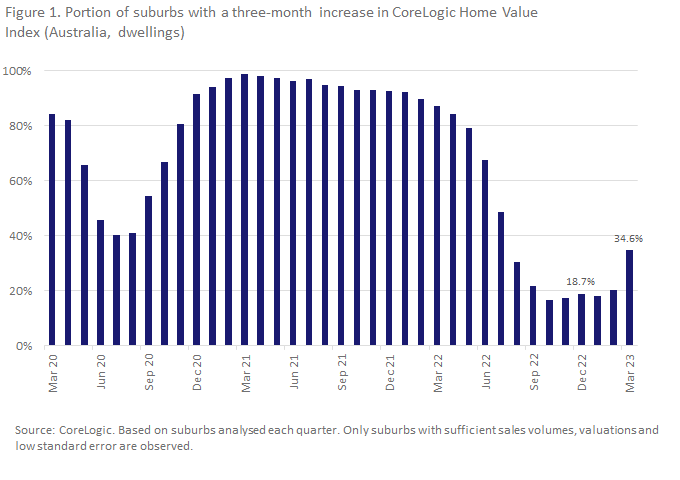
At a more granular level, this uplift in dwelling values has flowed through to around 35% of suburbs analysed in the March quarter. This proportion is up from 19% in the December quarter, and a substantial improvement on the recent low of just 16.5% of suburbs over the three months ending October 2022.
Of the top 25 performing suburbs this quarter, 20 are located in regional Australia, spread across SA, VIC, NSW, WA and Queensland. It has been common for regional Australia to dominate growth charts through the pandemic period, but as the cycle has matured, it seems to be more rural regional markets with particularly low price points that have seen the strongest rates of growth. The average median value of regional top-performing suburbs was $442,468. Dinner Plain in the Victorian Alps, 13km from Mount Hotham, is a striking exception among the top-performing regional suburbs, where values have trended higher following a slight dip through the second half of 2022.
The only capital city represented is Sydney, where top-performing suburbs are affluent North Sydney or North Shore suburbs. These suburbs are largely popular with owner-occupiers, having a higher than average owner-occupier rate of 76%, compared to an average 63% across Greater Sydney suburbs.
There was a relatively high volume of suburbs experiencing growth across Sydney and Perth. However, Sydney and Perth have very different growth dynamics. Sydney dwellings are showing signs of a rebound, following a peak-to-trough decline of around -14% over the year to January. Sydney often leads inflections in the housing cycle across capital city markets, and may be seeing a relatively high portion of markets in growth because it is moving through to the next cyclical phase. Strong recovery has been concentrated in the high end of the market, with the top five performing suburbs having median dwelling values of at least $1.5 million.
If Sydney is leading capital cities out of a downswing, Perth has yet to go through one. Perth dwelling values have held reasonably steady since rates started to rise, tracking just -0.4% below a recent high in July last year. This mild decline follows an upswing of 25.9% between June 2020 and July 2022. Home values across Perth are highly affordable due to subdued capital growth performance in the longer term, and have likely not been as impacted by recent rate rises as a result. If anything, it has been more affordable suburbs that led growth across Perth in the March quarter, including Forrestdale (up 4.7%), Bouvard (4.6%) and Falcon (3.7%), all located well south of the city.
Where (and why) are some suburbs rising in value?
Figure 3 shows the number of suburbs experiencing growth in values by greater capital city and region. The number of suburbs seeing growth tells us a bit about where these regions are in the cycle. For example, Hobart had just two suburbs that saw dwelling value increases in the quarter, as the city has moved through a steep peak-to-current decline of -12.9%. Steep price falls in the city follow more than seven years of almost un-interrupted growth, so it is somewhat unsurprising to see such an extended, broad-based decline.
Suburb growth outlook
Looking ahead, the proportion of suburbs recording a rise in values could start to trend higher. If this cycle mirrors historic ones, the higher-tier markets of Sydney and Melbourne are likely to show more suburbs in upswing over the coming months. However, the prevalence of highly affordable regional markets in the top performing suburb list is quite different to what we’ve seen in previous inflection points.
- In late 2019 when the market was showing signs of moving into an upswing, Sydney suburbs were topping capital growth charts.
- In mid-2012 when the market was moving into an upswing, resourced-based markets across WA and Darwin dominated.
- The current upswing could reflect a hangover of the pandemic and the interest rate environment, where affordable, regional property remains desirable.

Meet Eliza Owen
Head of Residential Research Australia
Eliza Owen was appointed the Head of Research at CoreLogic Australia in 2020.
Full profile