Sydney, Brisbane and Adelaide markets top chart for highest annual dollar value growth.
This month in CoreLogic’s Housing Chart Pack, we take a deeper dive into SA3-level performance over the past year, comparing annual % growth to annual $ growth.
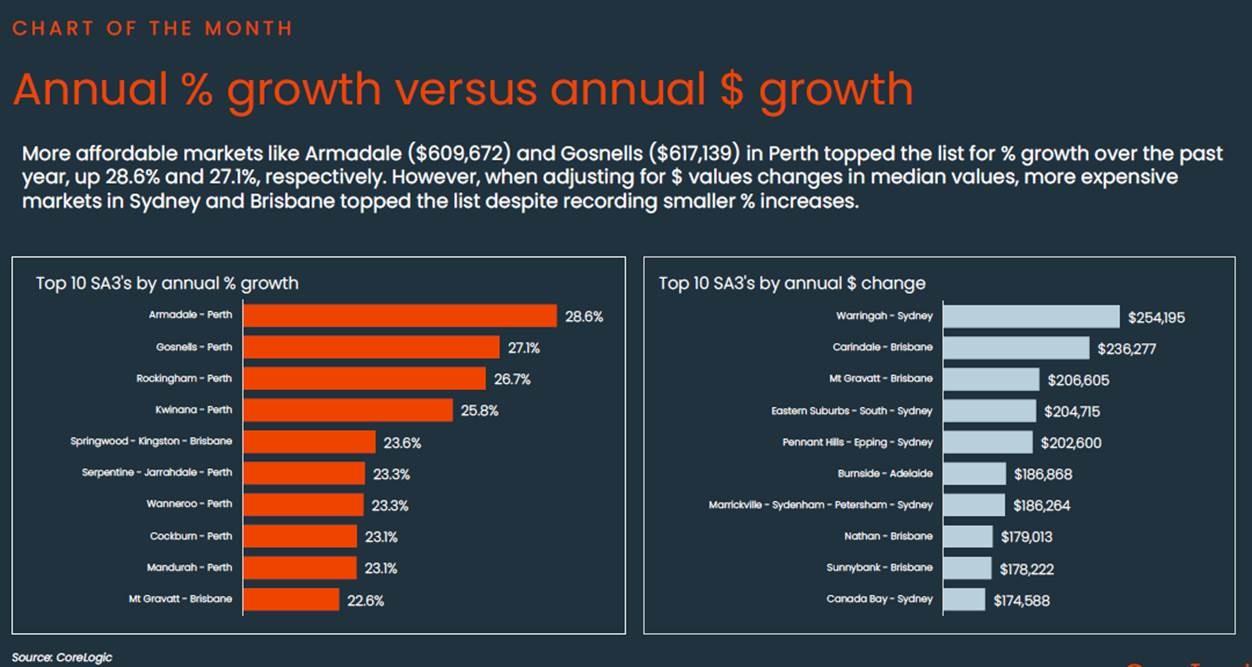
CoreLogic Head of Research Eliza Owen said some of the best value markets have floated to the top of the league tables when it comes to percentage capital growth.
“Armadale in the south east suburbs of Perth has a median dwelling value of $609,672, and values have risen a whopping 28.6% over the past year. Each of the top 10 SA3 markets with the highest growth rates were in Perth and Brisbane,” Ms Owen said.
“However, looking at growth by dollar value sheds some new perspective on how we look at value change over time. For example the 28.6% uplift in Armadale is the equivalent of an uplift in the median value of around $136,000. This is a notable increase, but it pales in comparison to some of the dollar value gains in the higher end of the market.”
For example, in Sydney’s Warringah, home values rose 14% in the past 12 months, the equivalent rise in the median home value topped the list of dollar value gains at $254,000.
Ms Owen said despite the fact that relatively small percentage-value increases can mean big gains in dollar terms, this doesn’t mean the high end of the market is the best option for investors seeking capital gains. She said the high end of the market is much less accessible (the median dwelling value in Warringah is over $2 million). This means transaction costs are higher, and more money would need to be concentrated in a single asset, as opposed to the ability to spread capital across multiple markets.
“The lower-priced end of the market is where we’re generally seeing higher rates of capital growth. That’s obvious when you look at the ‘lower quartile’ home value index for the combined capitals, which tracks value change in the bottom 25% of values. Values across the bottom 25% of the combined capital city markets were up 3.1% in the March quarter, around three times faster than the rate of growth in the top 25% of values (0.7%). This is fairly unusual for an upswing, because during periods of home value increases, the higher end of the market usually has higher growth rates,” Ms Owen said.
“It’s no surprise to see demand being skewed to the low end of the market, because rapidly rising interest rates mean that borrowing capacity has been squeezed. On average, borrowing capacity is estimated to have fallen around 30% since the start of rate rises, so prospective buyers have less financing to work with, and may be targeting cheaper markets as a result.
“There are other factors at play, like strong migration and labour market conditions in Western Australia, where properties are generally cheaper than in other states and territories.”
Other highlights from the April Housing Chart Pack include:
- CoreLogic estimates the combined value of residential real estate to be $10.3 trillion at the end of March.
- National home values rose 1.6% in the March quarter, the largest quarterly increase since the three months to November (1.9%).
- Despite an uptick in the quarterly growth trend, the annual growth trend ticked lower in March (8.8%), down 20 basis points from the 9.0% rise seen over the twelve months to February.
- Growth in regional dwelling values has continued to outpace growth across the capitals for the third consecutive month, with regional values up 1.8% over Q1 compared to a 1.5% rise across the combined capitals.
- Perth continues to lead capital growth performance in the greater capital city markets, with values up 5.6% in the three months to February and up 19.8% over the past year.
- National sales activity continues to trend higher, with an estimated 48,793 sales in March, taking the annual count to 506,612. This is 6.0% higher than the numbers seen over the year to March 2022 (477,757) and 4.8% above the average annual volumes seen over the previous five years.
- The time it takes to sell a home continued to trend slightly higher in March, with the median time on market rising to 36 days in Q1. While up from a recent low of 27 days in the three months to September, national selling times are still roughly in line with those seen this time last year (34 days).
- National vendor discounting rates compressed through the year's first quarter to -3.6%, down from -3.8% in December. Over the three months to March, capital city vendors were offered a median -3.1% discount to secure a sale, while regional vendors offered a larger -3.9% discount.
- Following the usual season patterns, auction activity across the combined capitals trended higher through March, peaking in the week before Easter (March 24th, 3,519) with the busiest auction week in almost two years.
- The additional auction numbers tested demand, with the capital city clearance rate continuing to trend lower through March, averaging 66.4% over the four weeks ending March 31st.
- Australian rent values continued to trend higher in March, up 1.0% over the month and 8.6% over the year to March. The annual rental growth trend has been drifting upwards since October (8.1%), led by a re-acceleration in house rents, from 6.8% over the year to September 2023 to 8.4%.
- Dwelling approvals continued to slide lower in February, with just 12,520 new dwellings approved. This was driven by a -20.8% decline in the more volatile unit segment, while house approvals rose 10.5% compared to January.
- The value of new housing finance commitments rose 1.5% in February, led by a 4.8% increase in first-home buyer lending. Compared to the same time last year, new loan commitments were up 13.3% in February, with investor and first-home buyer financing up 21.5% and 20.7% year-on-year, respectively.
Download the Monthly Housing Chart Pack
CoreLogic Australia