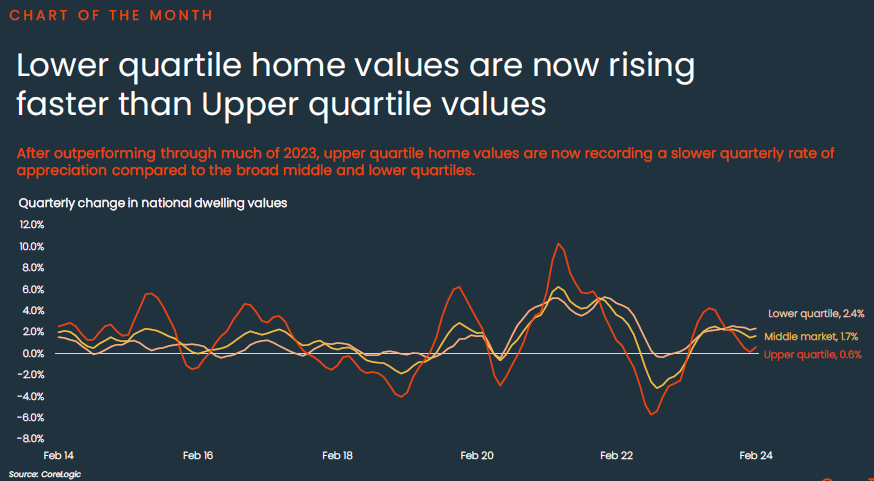
After outperforming through much of 2023, upper quartile home values are now recording a slower quarterly rate of appreciation compared to the broad middle and lower quartiles, CoreLogic’s March Housing Chart Pack shows.
Historically, the upper quartile of the housing market tends to lead the cycles, both into the upswing, but also into downturns.
Research director Tim Lawless said this trend has once again played out through 2023 and early 2024, with the upper quartile of the market leading the upswing through the first seven months of 2023, but slowing more sharply through the second half of last year and into early 2024.
“This trend is most evident in Sydney, Melbourne and, to a lesser extent Brisbane, where upper quartile values clearly led the 2023 upswing through the first half of the year. The trend hasn’t been evident in Perth or Adelaide where lower quartile home values have consistently recorded a faster pace of capital gains through 2023 and the first two months of 2024,” he said.
“The lower quartile across every capital city has recorded a stronger outcome for housing values relative to its upper quartile counterpart over the past quarter. Perth has the largest gap between lower and upper quartile based on the change in dwelling values over the past three months, with a 2.2 percentage point difference, followed by Adelaide (1.6pp) and Brisbane (1.5pp). Sydney and Melbourne have a 0.7pp difference, followed by Hobart and Darwin (0.6pp), while Canberra has the smallest growth gap (0.4pp).”
Other highlights from the March Housing Chart Pack include:
- The value of residential real estate increased to an estimated $10.4 trillion at the end of February - a new record high, up from $10.3 trillion in the previous month.
- The pace of quarterly national home value growth accelerated to 1.3% over the three months to February, up from 1.0% over the three months to January.
- The annual growth trend also ticked higher in February, with national values up 8.9% over the past 12 months. This is the highest annual increase since the FY 2021-22 when values rose 10.8%
- Values across the country's most affordable 25% of the market are now rising the fastest, up 2.4% over the three months to February. Values across the broad middle of the market rose 1.7% over the rolling quarter, while the upper quartile recorded a milder 0.6% increase.
- Perth continues to lead capital growth performance in the greater capital city markets, with values up 5.2% in the three months to February and up 18.3% over the past year.
- The rolling annual count of national sales exceeded 500,000 for the first time since Dec 22, with an estimated 500,580 sales recorded over the year to February.
- Annual sales activity across the combined capitals was up 6.0% compared to the year to Feb 23 and 8.2% higher than the previous 5-year average, while sales across regional markets were down -2.1% and -3.7%, respectively.
- The median time on market continued to track higher in February, with properties taking an average of 38 days to sell in the three months to February. Capital city homes took approximately 38 days to sell, up from 24 days in November, while regional homes are selling in 50 days on average, up from 36 days.
- Vendor discounting rates remained relatively steady in February at -3.8%. Although up slightly from the -3.6% discounts offered over the three months to November, the median vendor discount is still well below the -4.3% discounts that were being offered this time last year.
- Although up from last year, the weekly final clearance rate has been easing since the second week of February, with just 67.5% of auctions in the week ending 3rd March recording a successful result.
- Monthly dwelling approvals fell a further -1.0% in January, led by a -9.6% decline in house approvals, while the more volatile unit sector saw approvals rise 14.5% month-on-month. With just 7,565 detached dwellings approved, the January result was the lowest monthly count of house approvals since June 2012 (7,411).
Download the Monthly Housing Chart Pack
CoreLogic Australia