In today's Pulse article, Eliza Owen shares an update on the state of Australia's rental market.
The median weekly rent value across all Australian dwellings has hit a fresh record high of $627 per week, and rental costs range from $770 per week in Sydney, to $547 in Hobart.
Figure 1. Summary of median weekly rent and value change – data as of April 2024
Region | Median weekly rent | Monthly change in rents | Quarterly change in rents | Annual change in rents |
Sydney | $770 | 1.0% | 3.0% | 9.0% |
Melbourne | $589 | 0.8% | 2.8% | 9.6% |
Brisbane | $649 | 0.8% | 2.1% | 8.5% |
Adelaide | $589 | 0.6% | 2.4% | 9.1% |
Perth | $669 | 1.2% | 3.9% | 13.6% |
Hobart | $547 | 0.2% | 2.5% | -0.2% |
Darwin | $617 | -0.3% | -0.1% | 3.5% |
Canberra | $674 | 0.6% | 1.9% | 1.8% |
Combined capitals | $659 | 0.9% | 2.9% | 9.4% |
Combined regionals | $540 | 0.7% | 2.5% | 6.4% |
National | $627 | 0.8% | 2.8% | 8.5% |
Rather than rent increases being limited by affordability constraints, annual rent growth has once again started gathering pace at the start of 2024. Nationally, annual rent growth went from a recent low of 8.1% in October 2023, to 8.5% in April.
Even markets where rents had been falling are now showing values start to steady, or increase again.
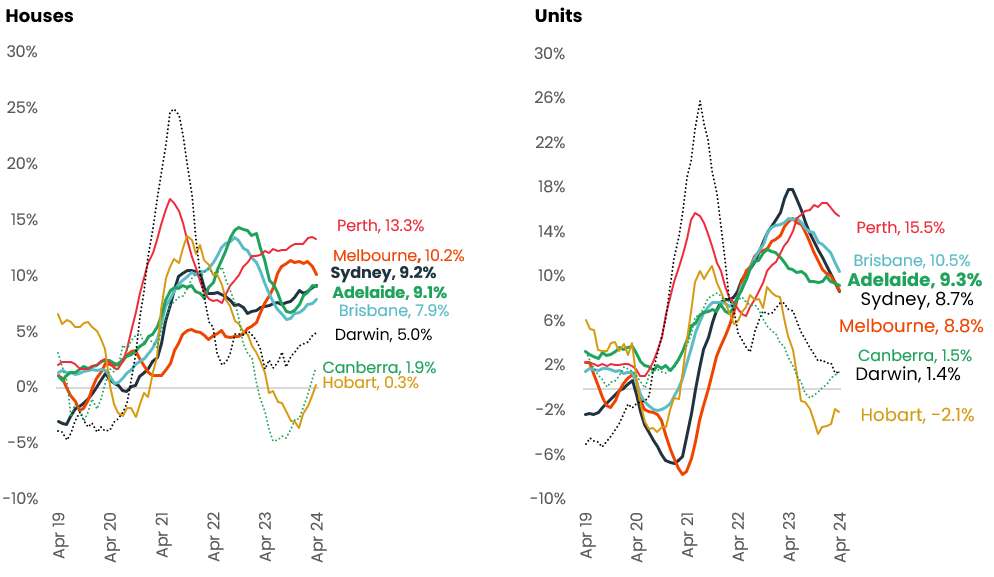
Figure 2 shows rolling annual growth in house and unit rents by greater capital city area. Canberra house rent falls bottomed out at -3.4% in the year to September, though rents have been rising over the past seven months, taking the market back into a year-on-year increase of 1.8%. In Hobart, house rents are back in positive growth territory, and unit rents seem close to flattening out.
Figure 2. Rolling annual change in rent values, houses and units
Regional rent growth is also back on the rise
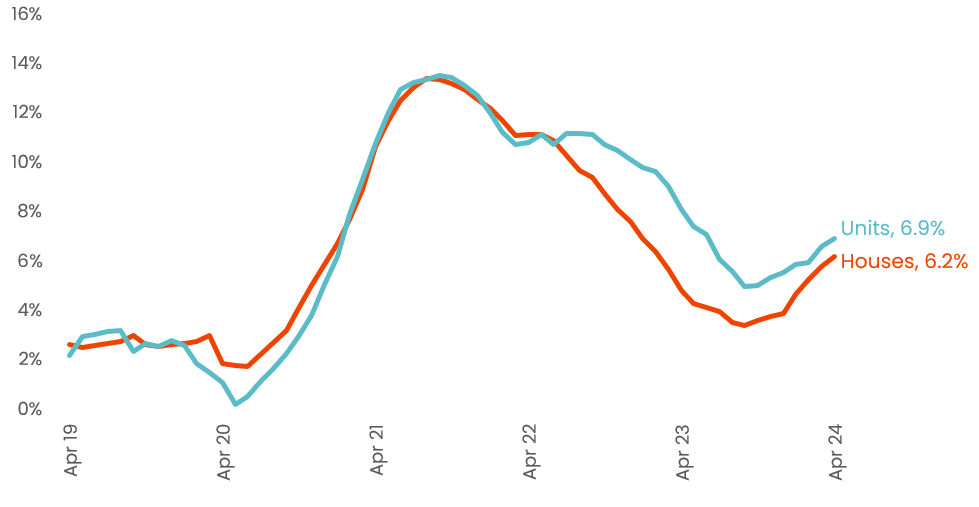
In Figure 3, annual growth in regional unit rents bottomed out at 5.0% in the year to September, and climbed back up to 6.9% in the 12 months to April. Regional house rents have seen an even more dramatic reacceleration, where annual growth in rents has gone from 3.4% in September to 6.2% in April this year. The pick up in regional rent growth was most pronounced in regional QLD and Tasmania houses (each saw a pick up in annual growth of 350 basis points between September 2023 and April this year).
Figure 3. Rolling annual change in regional Australia house and unit rents
Renters forced into more affordable options
Part of the reason for the re-acceleration in rents nationally could be due to renters being forced into more affordable, peripheral housing markets as they become priced out of more desirable and central metropolitan locations. Areas where rents are slightly lower may offer more space for group households or have slightly less competitive rental conditions which are potentially being more targeted by prospective tenants.
Between October last year and April this year, growth re-accelerated most strongly in greater capital city areas within 30-40km of city centres. In Sydney, this included Campbelltown, where annual growth went from 9.1% in October to 13.4% in the year to April. In Brisbane this included Jimboomba, where annual rent growth went from 3.8% to 6.4% in the same period. Casey – North in Melbourne is also within this distance, where annual house rent growth went from 11.7% to 13.1% in the same period.
While these outer-suburban markets are seeing the most rapid re-acceleration in rents, the pickup in rent growth has been fairly broad-based, with only rent markets within 10 km from city centres showing a consistent easing in average annual growth. Many of these markets are only seeing rent growth ease from a very recent high.
Outside of these regional variations, supply and demand pressures remain high across Australia’s rental market more broadly.
On the demand side, experimental estimates from the ABS suggest average household size only continued to decline to 2.50 people in June 2023. This comes despite a material uplift in group households, which was far outpaced by a rise in lone and two-person households.
Net overseas migration in the year to September was just under 550,000, with temporary visa holders accounting for over 90% of this figure. This means overseas arrivals were particularly likely to skew to rental accommodation through the period. Considering an average household size of 2.5 people, net overseas migration levels implied new household formation of over 200,000 in the year to September. At a time where supply constraints persist in the residential construction industry, only 173,000 new dwellings were completed in the same period.
Given there is little that can be done on the supply side for renters in the short term, reprieve in the rental market is most likely to come from a moderation in net overseas migration, as some temporary migrants start to depart, and arrival numbers normalise post-COVID. Centre for Population forecasts indicate this could occur from next financial year. Until then, renters may be seeking more shared accommodation, or exploring cheaper rental markets across the outer metro fringes or regional Australia.
Regions that fell from peak records
Despite weekly rents being at record highs nationally, the more granular rent market data shows some markets are still below peak. CoreLogic analysed 310 SA3 markets across Australia, and there were 66 regions (just over a fifth of areas analysed) where values are not at record highs.
Around 9% of SA3 rent markets in Australia have just started to slip from recent highs
Of the SA3 rent markets analysed, 9% were down from peaks in February or March this year, suggesting they were slipping from recent highs. Unfortunately for renters, these markets had only seen declines from recent highs of -0.4% on average, or the dollar value equivalent of $2 less on median weekly rents. The 27 markets did not have one discernible trend, and included high-end Sydney spots like Manly, Hornsby and Pittwater, lifestyle regions like the Mornington Peninsula in Melbourne and Sorell - Dodges Ferry in Hobart, and rural regions like Dubbo and Albany. It is worth noting there is strong seasonality in rent data, so even these slips from recent highs may not be indicative of a longer-term trend.
Rent markets with more sustained discounts
Other markets had more sustained declines from their peak. Some of these were more remote, regional areas such the South East Coast market of Tasmania where rents were down -16.5% (or $84) from their high in January 2023. A drawcard for our major regional centres, the popular Southern Highlands market of NSW has not only had subdued annual rent growth of just 0.8%, but rents in this region were down -5.4%, or $41 per week, for the high in May 2022. Shoalhaven is also down -1.7% from the high in July 2022, the equivalent of a $10 fall on weekly rents, which peaked at $599 per week.
Some pockets of the Sydney rent market were also below peaks from 2023, such as Canterbury, Pennant Hills – Epping and Parramatta, but the fall from peak in these areas were closing in quickly, as rent values rose an average of 8% in those markets in the past year.
By far the biggest falls from peak were across the Pilbara, where despite surging rents in recent years, they have not returned to the highs associated with the 2010s resource boom. East Pilbara rents are -37.9% (the equivalent of $509 lower) than the record high in October 2012. In West Pilbara, weekly rents are still -24.6% (or $321 lower) than in October 2011.

Meet Eliza Owen
Head of Residential Research Australia
Eliza Owen was appointed the Head of Research at CoreLogic Australia in 2020.
Full profile