Download the full May Housing Chart Pack
Here are the must know stats, facts and figures on Australia's residential property market.
Outer suburban markets lead capital gains
Australia’s outer suburban housing markets have outpaced their inner-city counterparts over the past year, with new Cotality data confirming the nation’s strongest housing conditions are concentrated in the fringes of each capital city.
Cotality’s Graph of the month, featured in the monthly chart pack, shows the lower quartile of the housing market has led capital growth over the past 12 months, reflecting heightened demand for more affordable homes as buyers navigate continued serviceability constraints and stretched affordability metrics.
Cotality’s Research Director, Tim Lawless, said that despite broad economic headwinds, strong capital growth has clustered in city outskirts where home values remain “just” within reach for many Australians.
“Households are making pragmatic decisions in response to tighter borrowing capacity and higher mortgage costs.”
“That’s pushed demand towards the lower quartile of the market, and it’s across the outer suburbs that this value-driven demand is translating into the strongest growth.”
The trend is visible in every capital city.
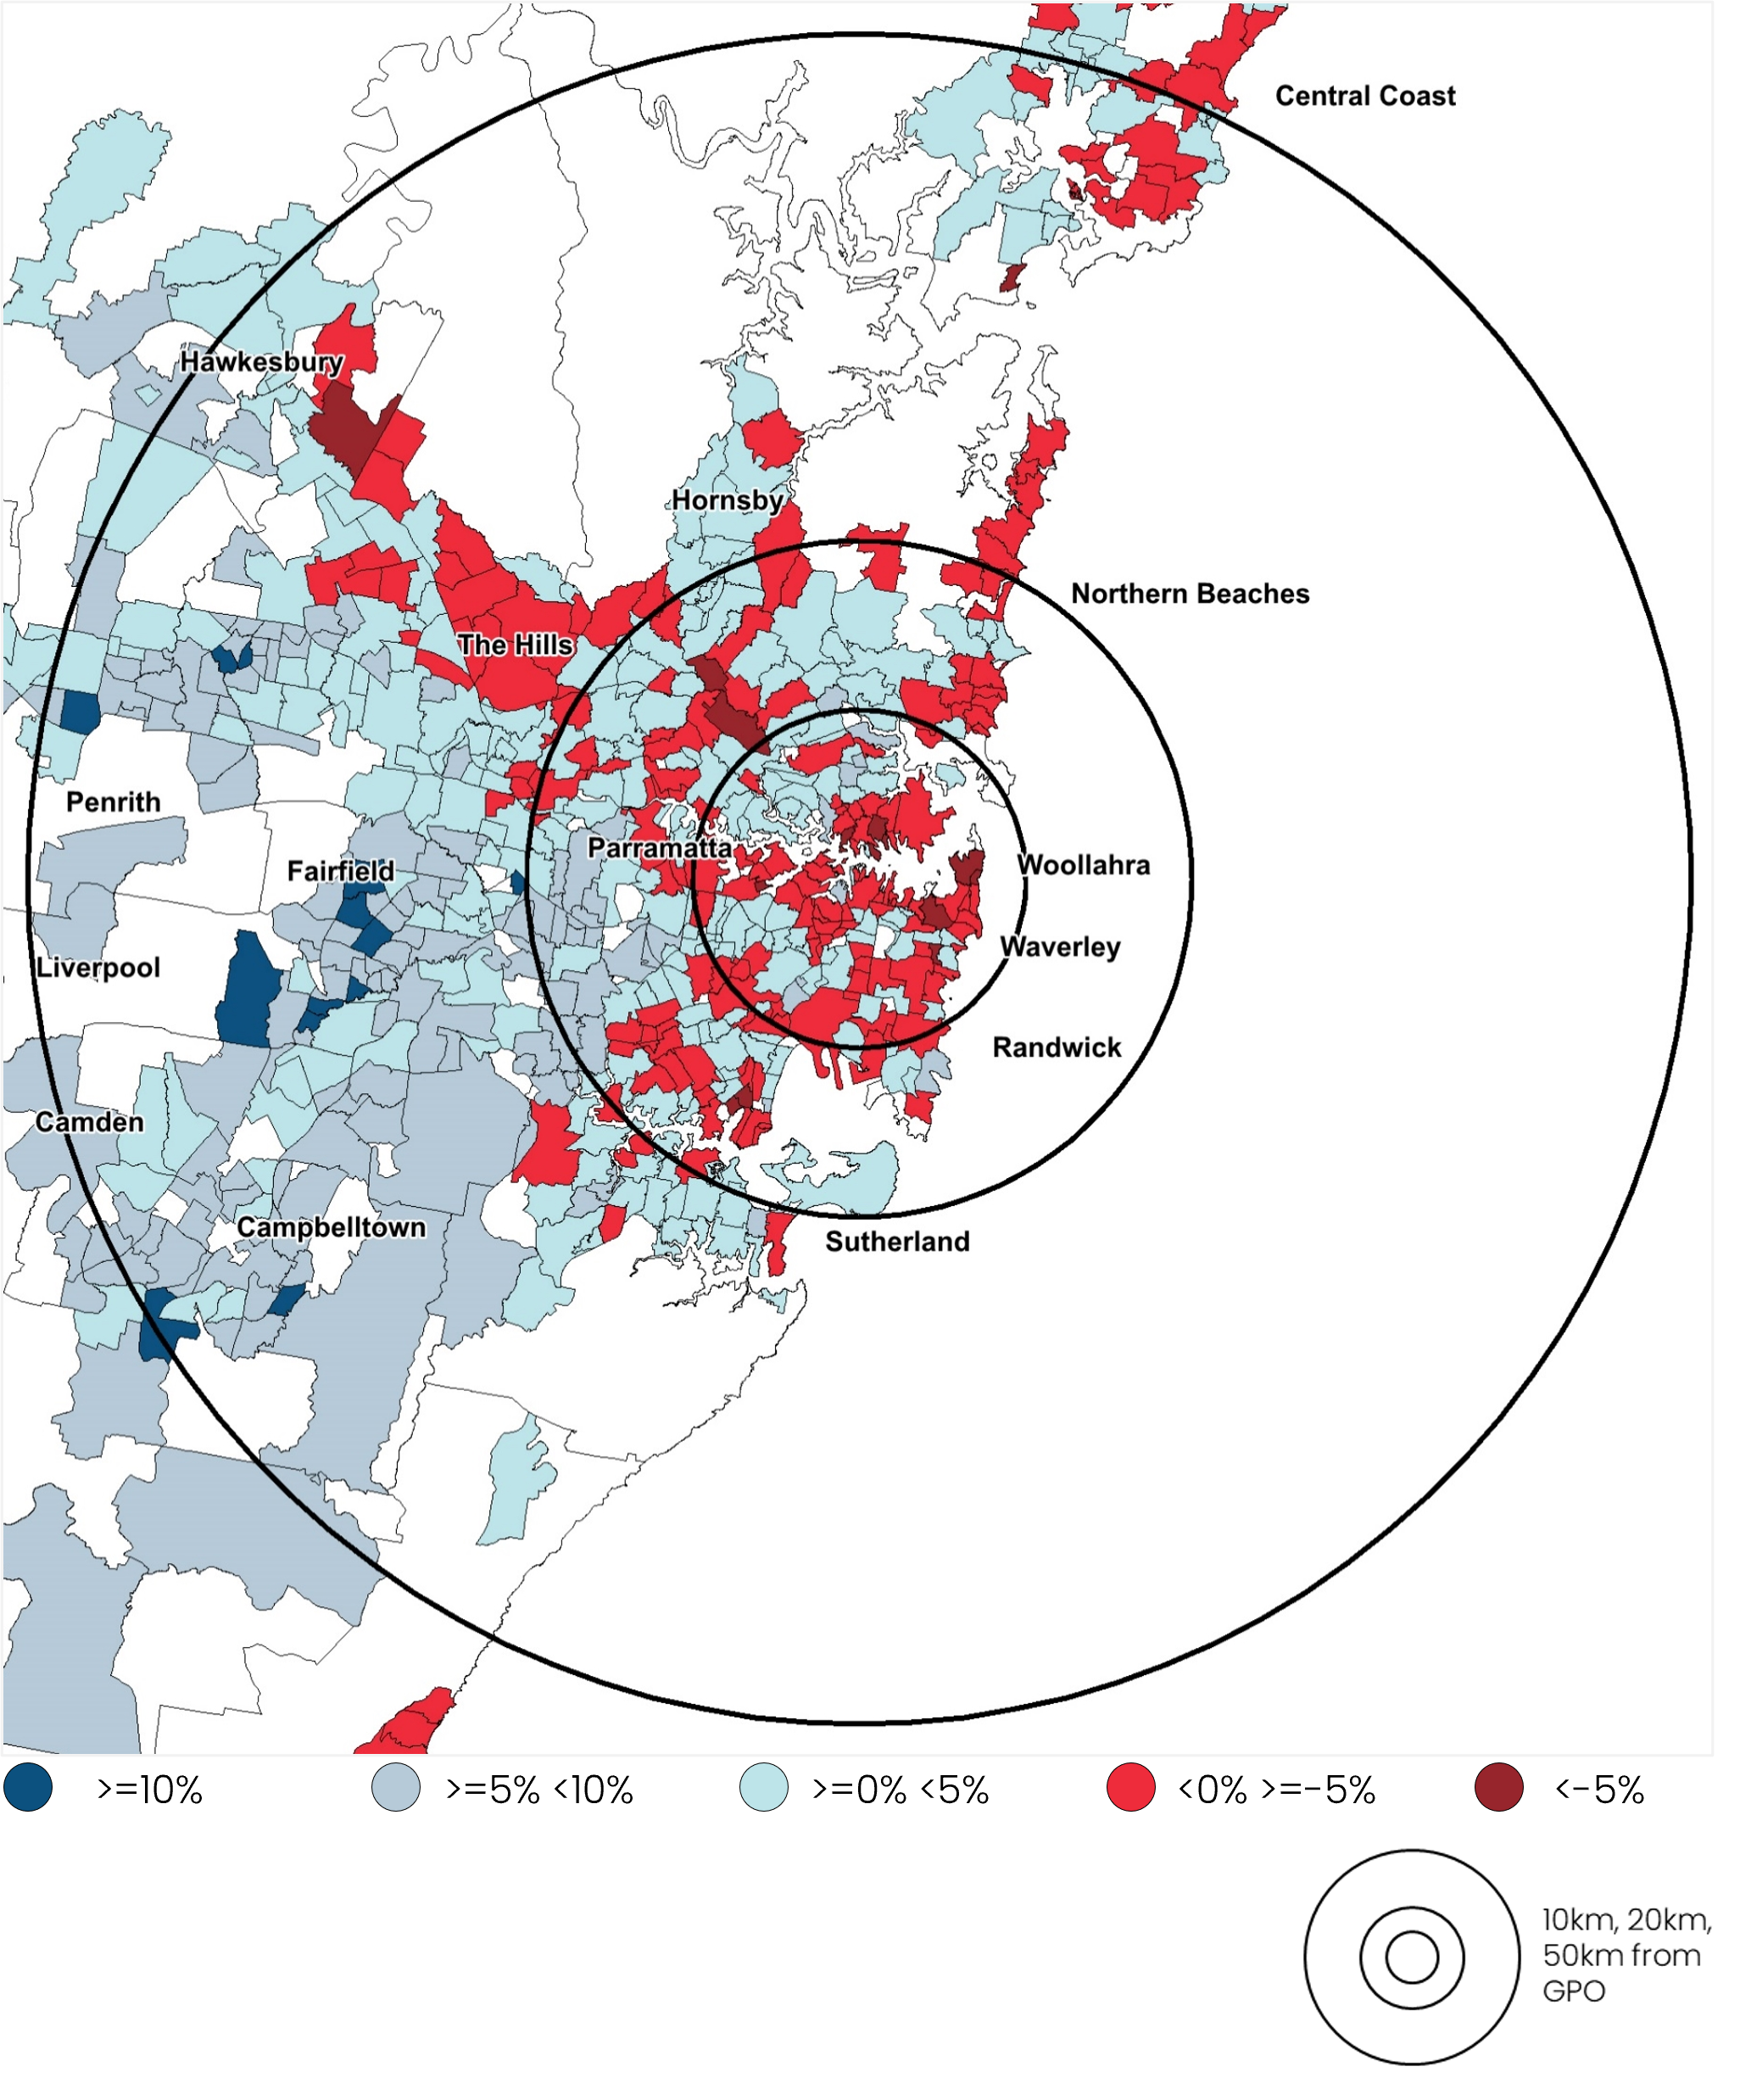
Sydney
In Sydney, all of the top twenty suburbs for annual growth were at least 20km from the CBD, with Fairfield, Liverpool and Blacktown LGAs dominating the city’s top 20 list. Notably, 81% of suburbs 20km or more from Sydney’s GPO recorded annual gains, compared with only 26% of those within 5km.
Change in dwelling values, 12 months to April 25
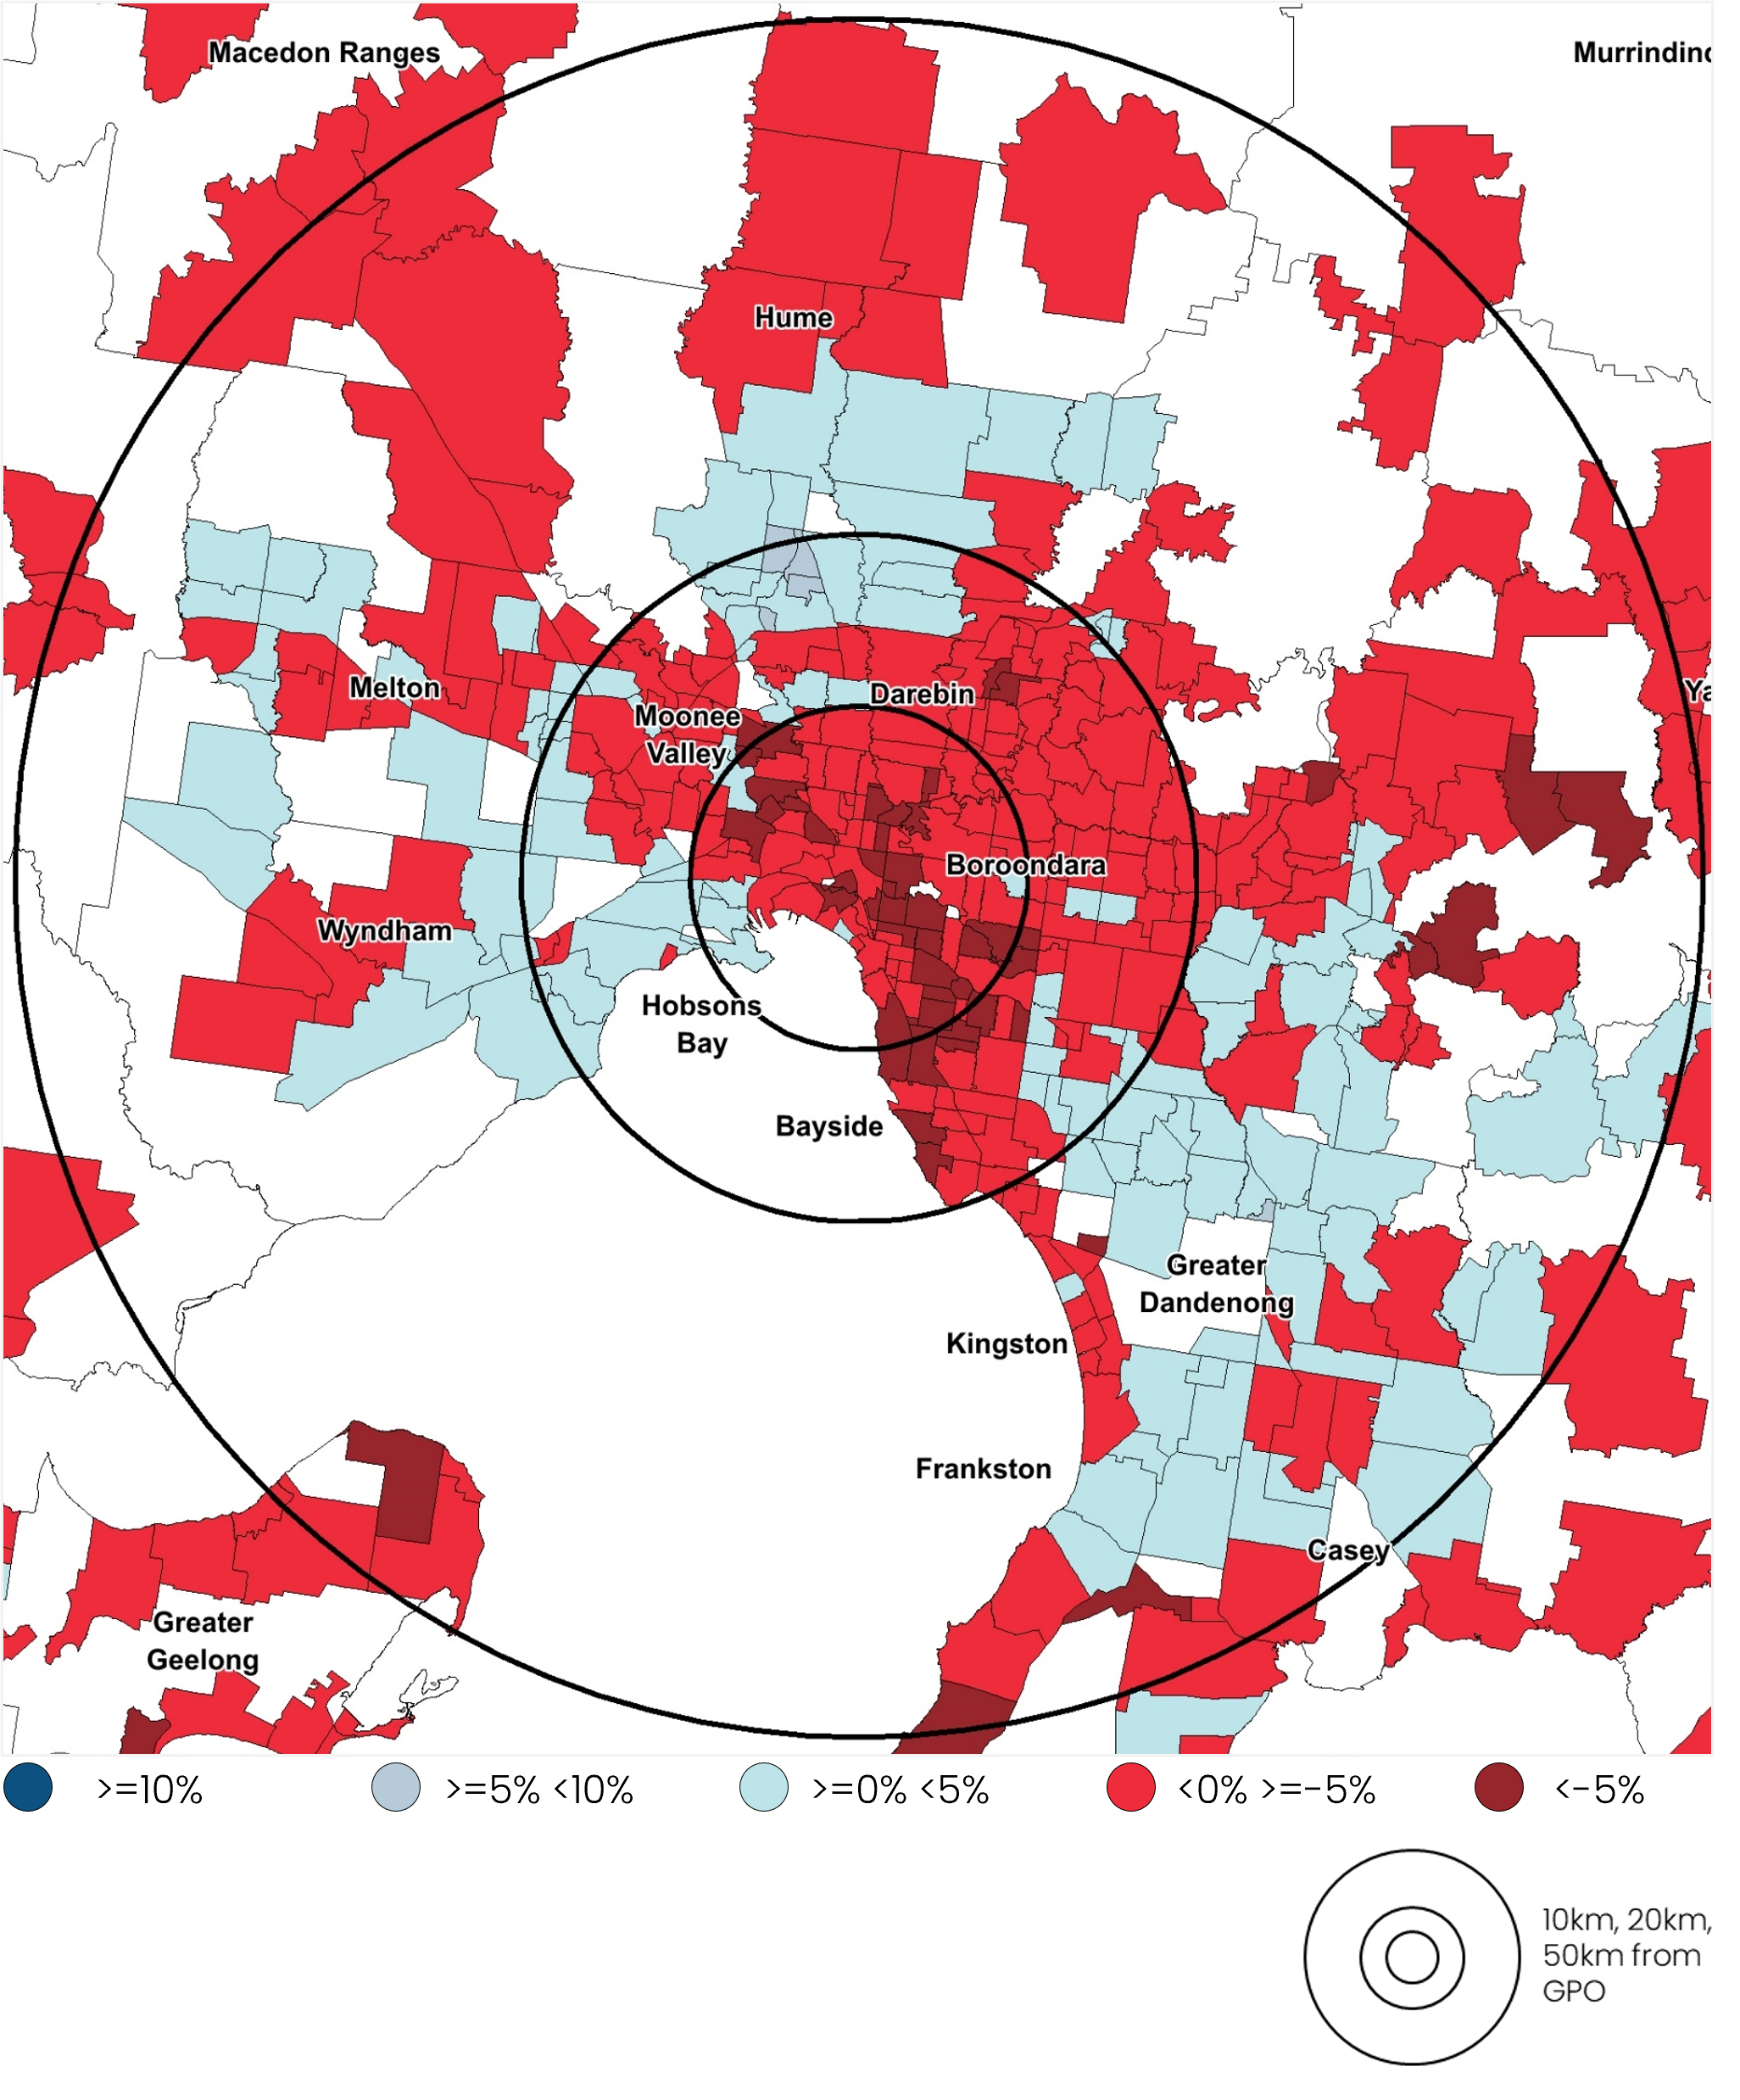
Melbourne
Melbourne followed a similar pattern, where despite broader market softness, 38% of suburbs 20km or more from the CBD recorded growth, with Hume, Frankston and Casey LGAs emerging as standout performers.
In contrast, just 4% of suburbs within 5km of the city saw a rise in dwelling values.
Change in dwelling values, 12 months to April 25
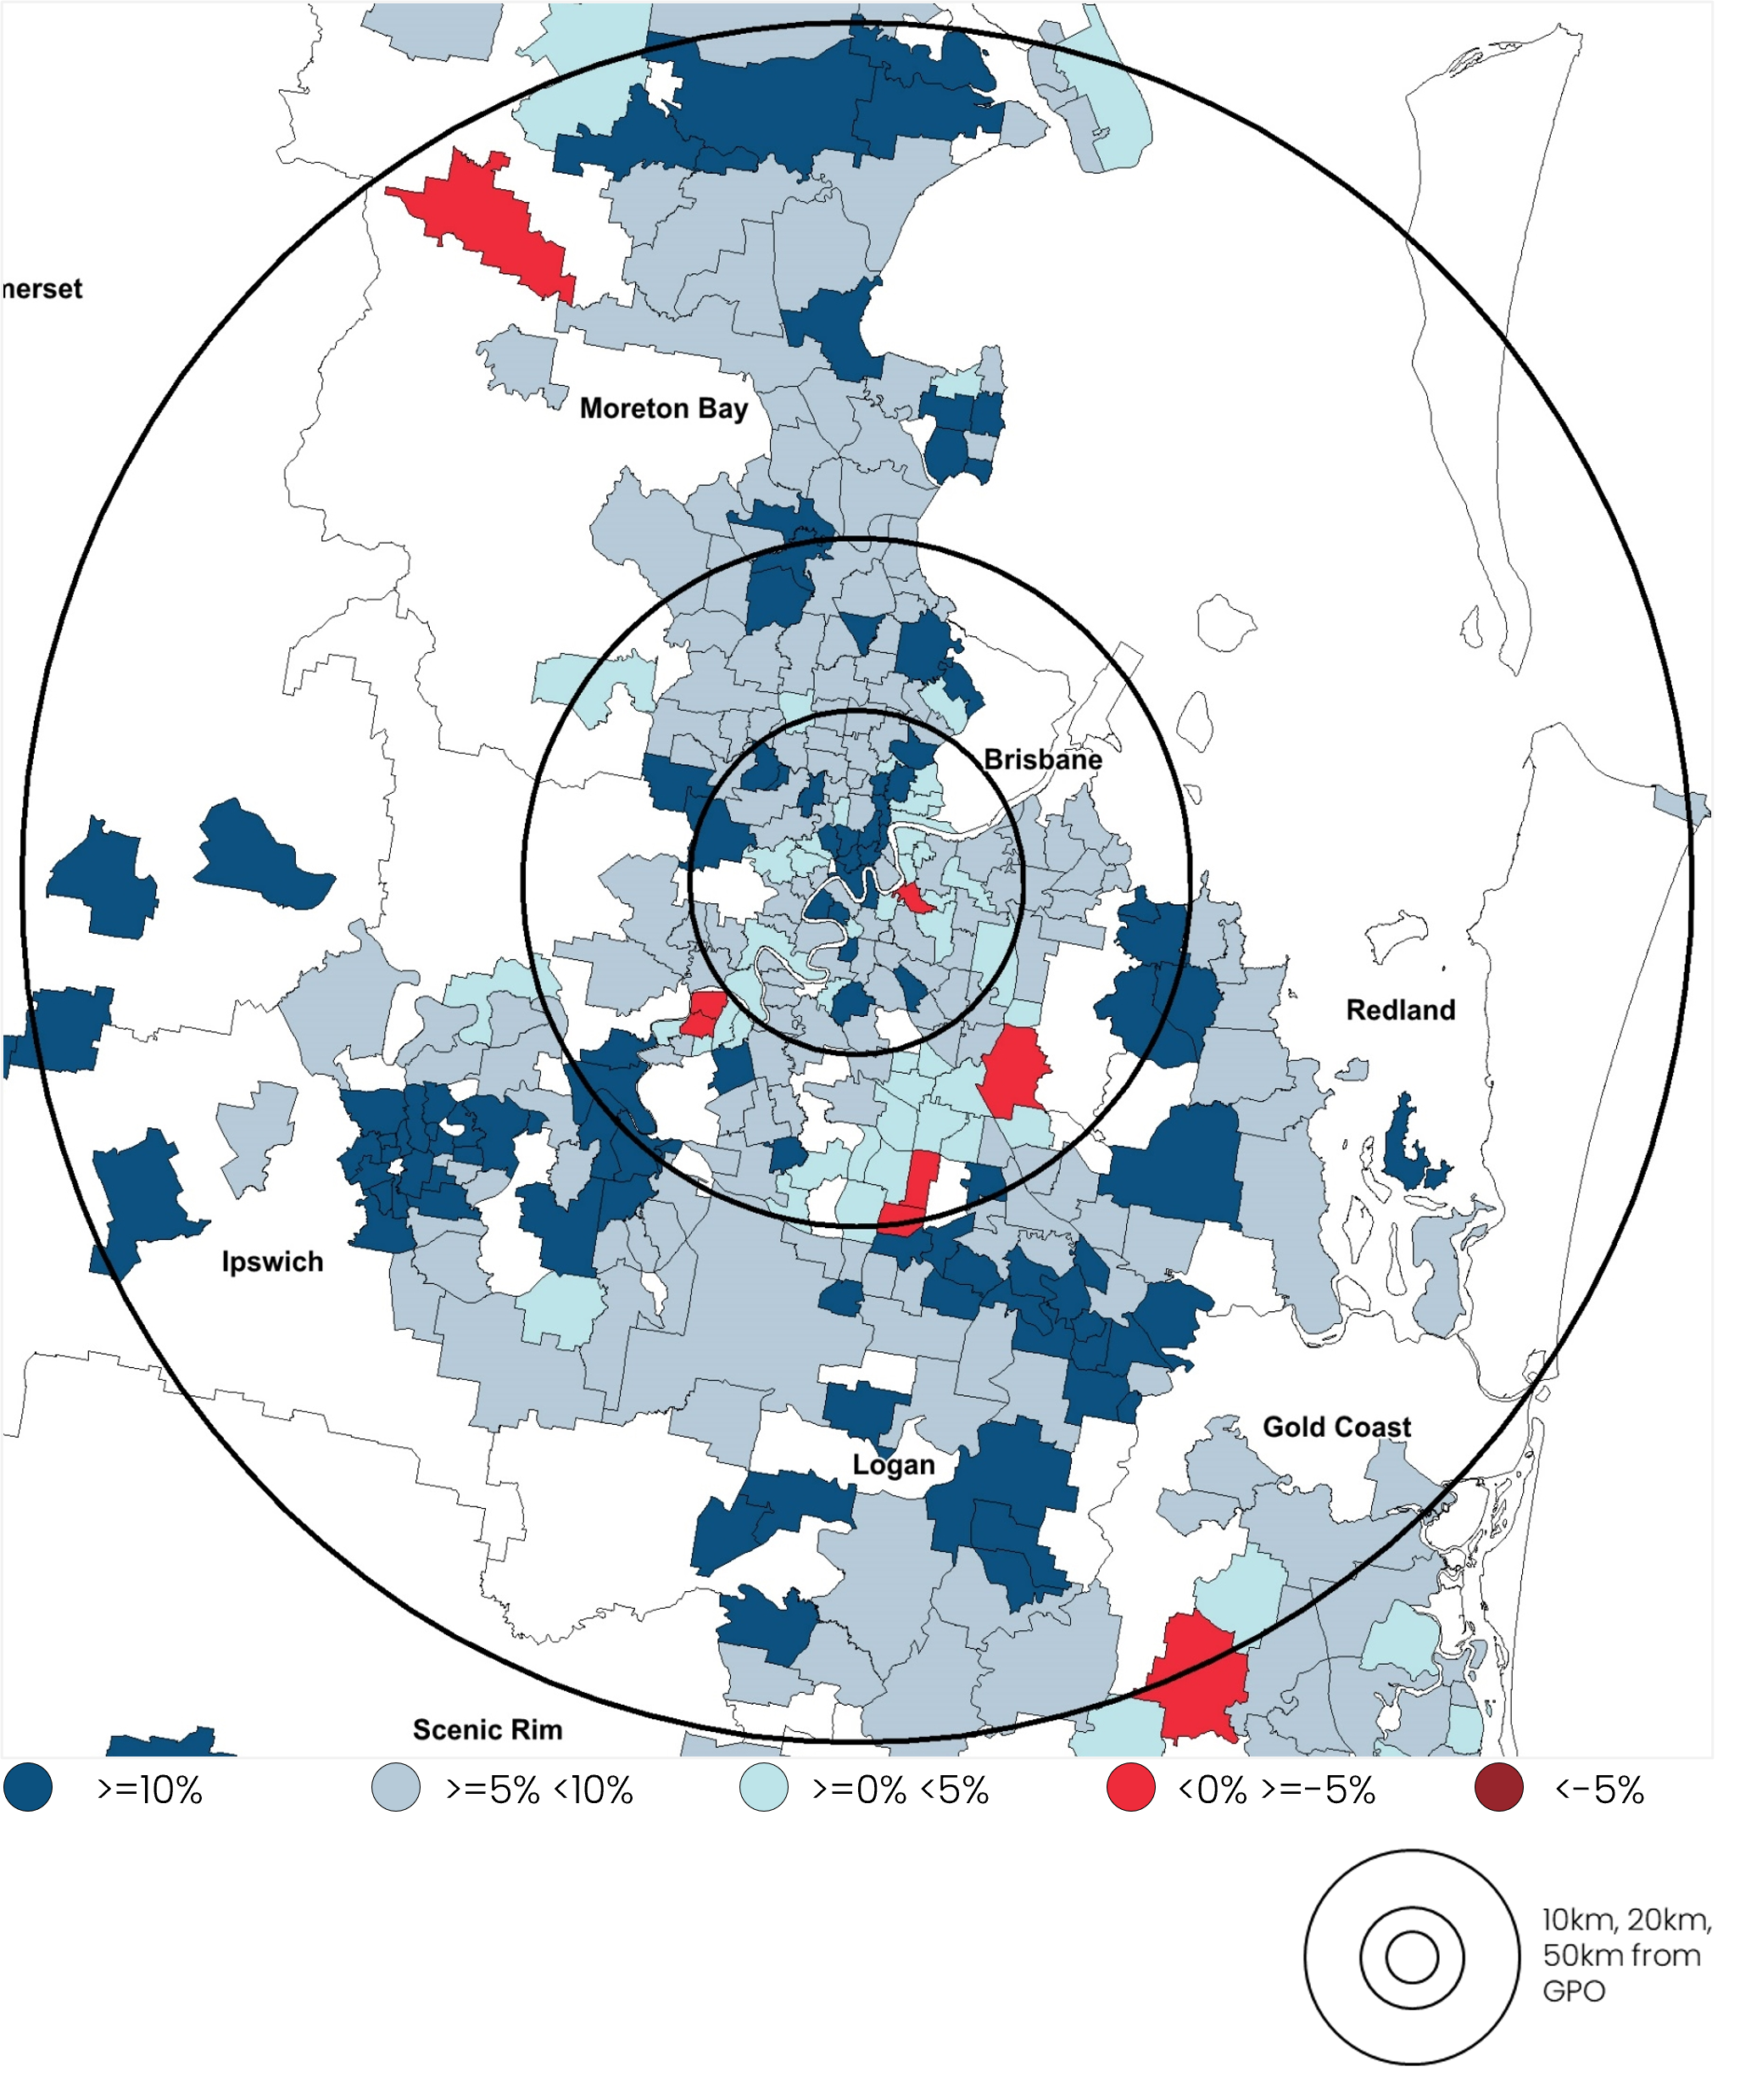
Brisbane
Growth was even more widespread across mid-sized capitals, but again skewed to the outer rings.
In Brisbane, only 2% of suburbs across the metro region have recorded a decline in value over the past 12 months. Although growth conditions are broad-based, values across the lower quartile of the market are up 14.0% over the past 12 months compared with a 4.8% rise in values across the upper quartile. Across the top 20 suburbs recording the highest annual gain in values, 17 were located at least 20km from the Brisbane GPO, with more than half (11) of the top 20 located within the Ipswich LGA.
Change in dwelling values, 12 months to April 25
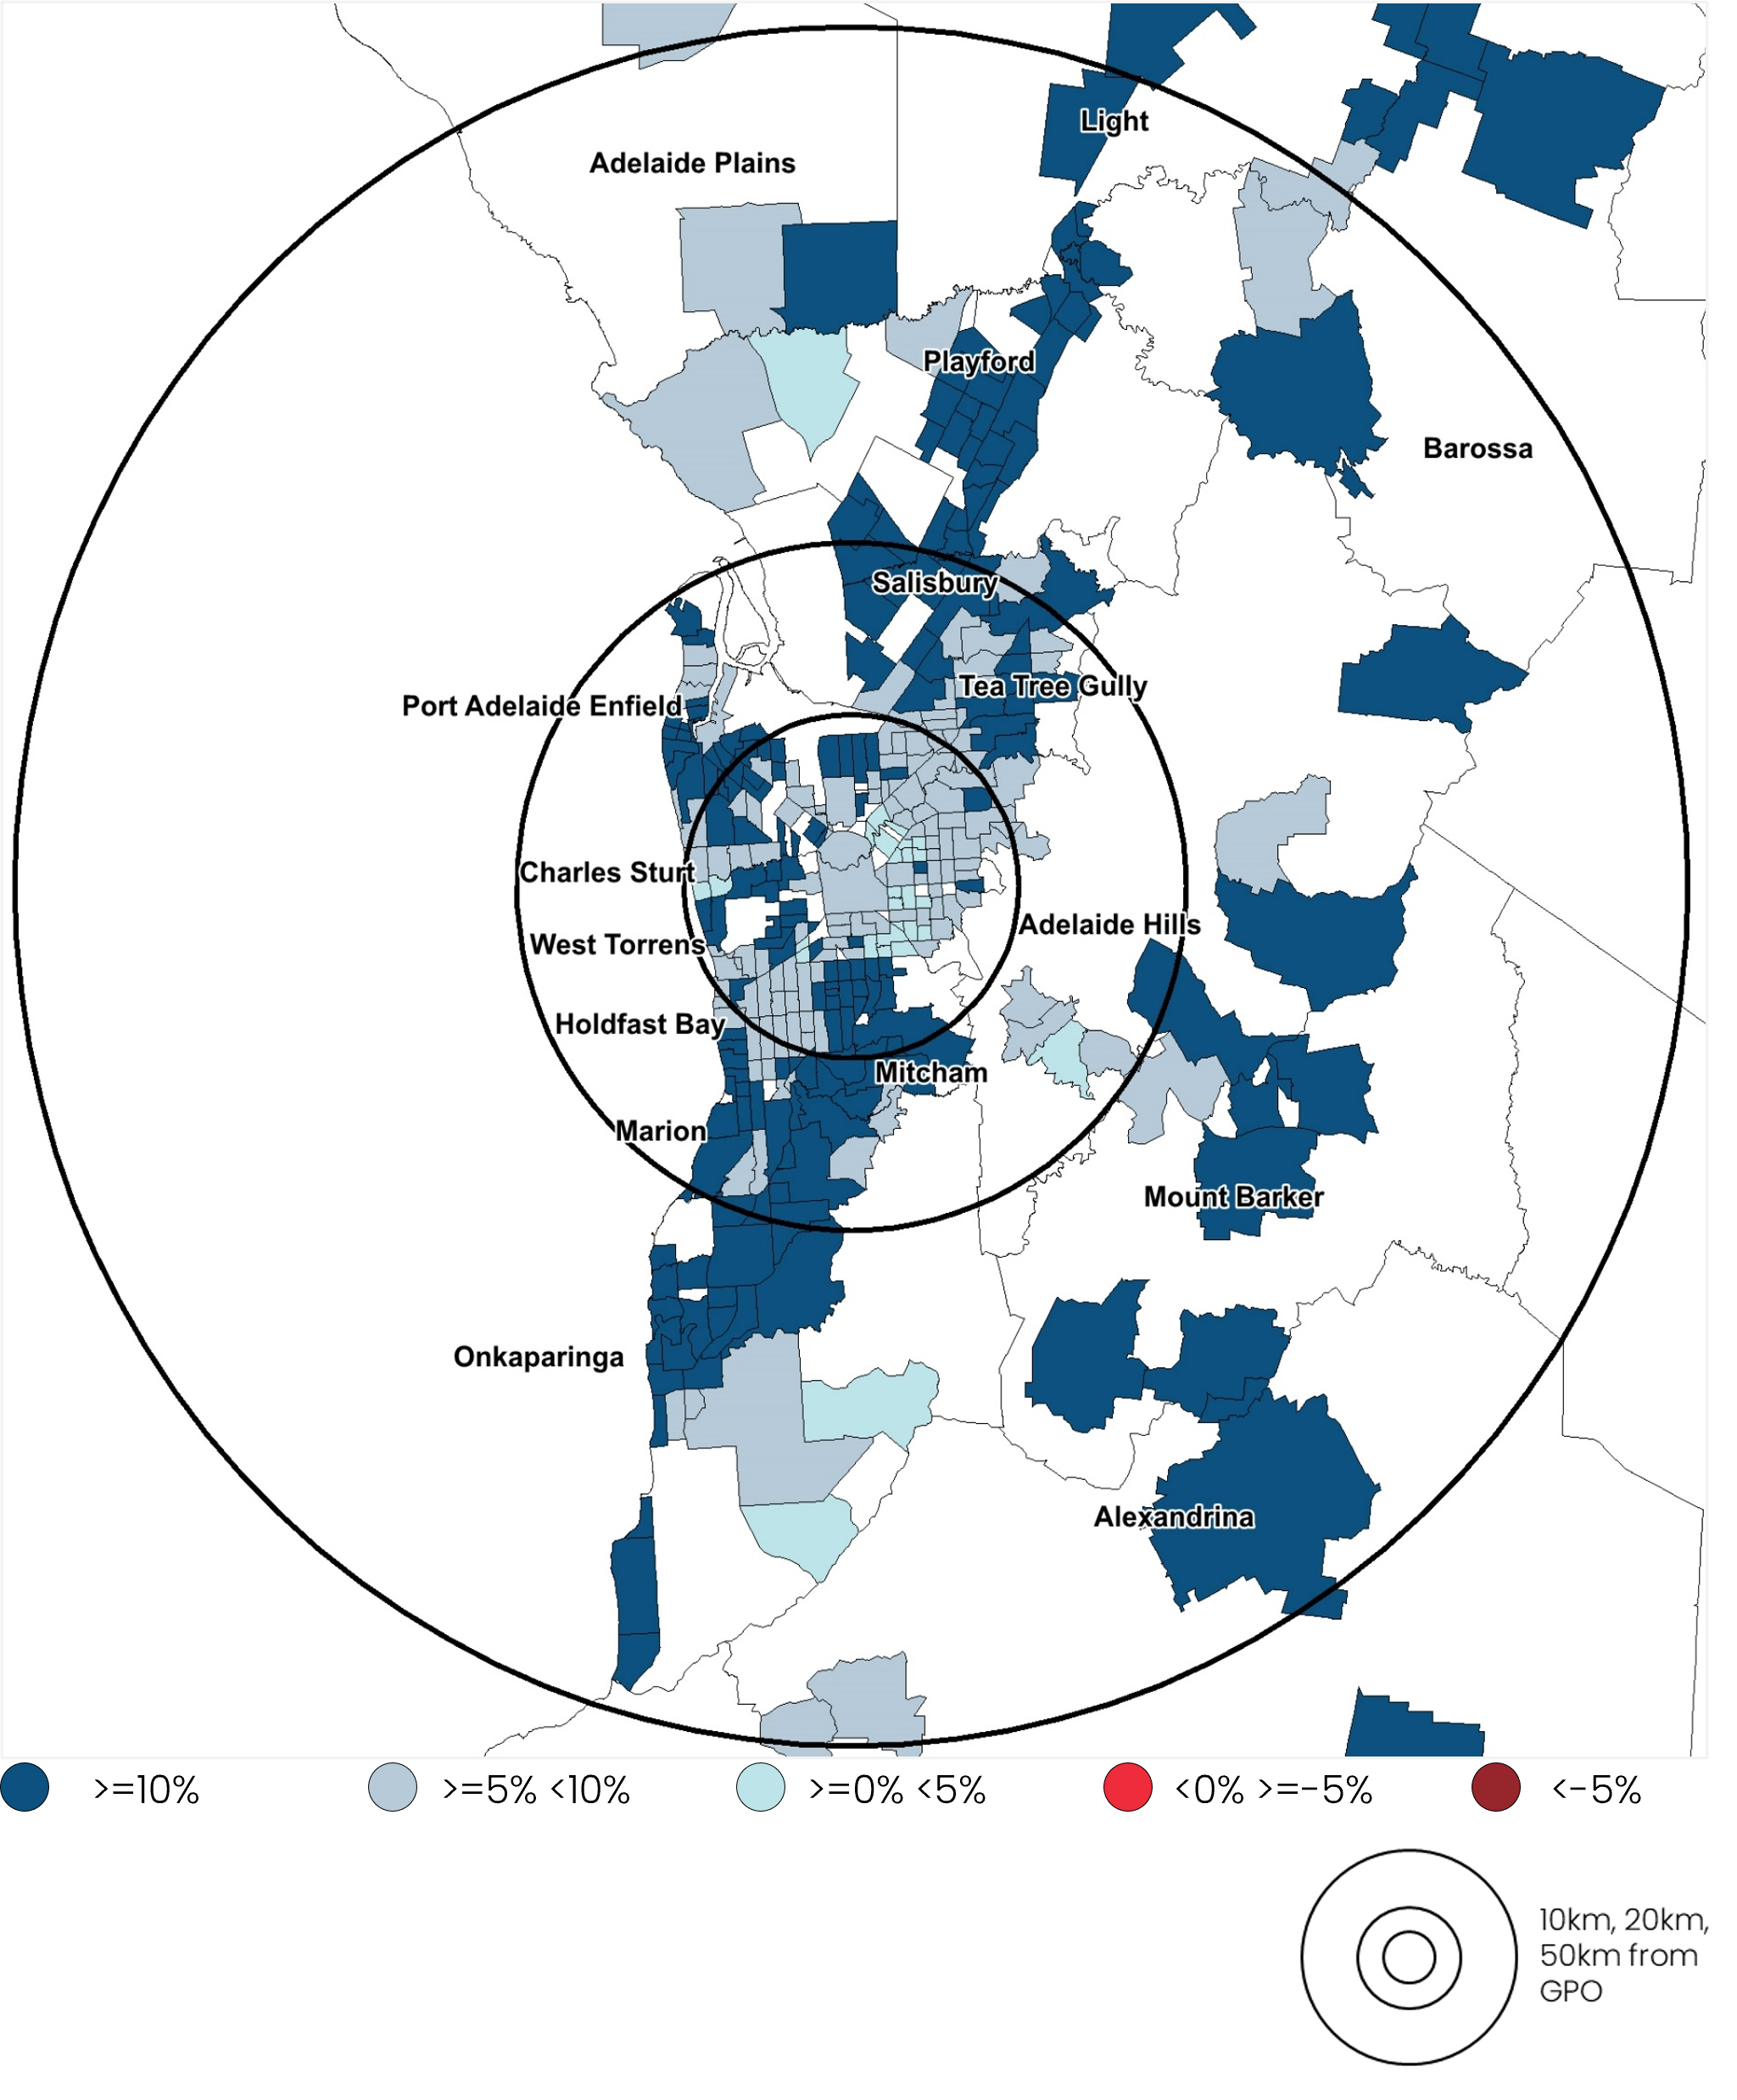
Adelaide
Adelaide has seen dwelling values rise by 9.8% over the past twelve months, with every suburb recording a rise. The strongest gains across Adelaide have been concentrated across the lower quartile of the market, with values up 15.2% compared with a 7.3% gain in values across the upper quartile. 16 of the top 20 suburbs for annual gains in value were located at least 20km from the Adelaide GPO, with the strongest conditions skewed towards the northern suburbs. 7 of the top 20 growth suburbs were located within the Playford LGA, and 5 in Gawler LGA.
Change in dwelling values, 12 months to April 25
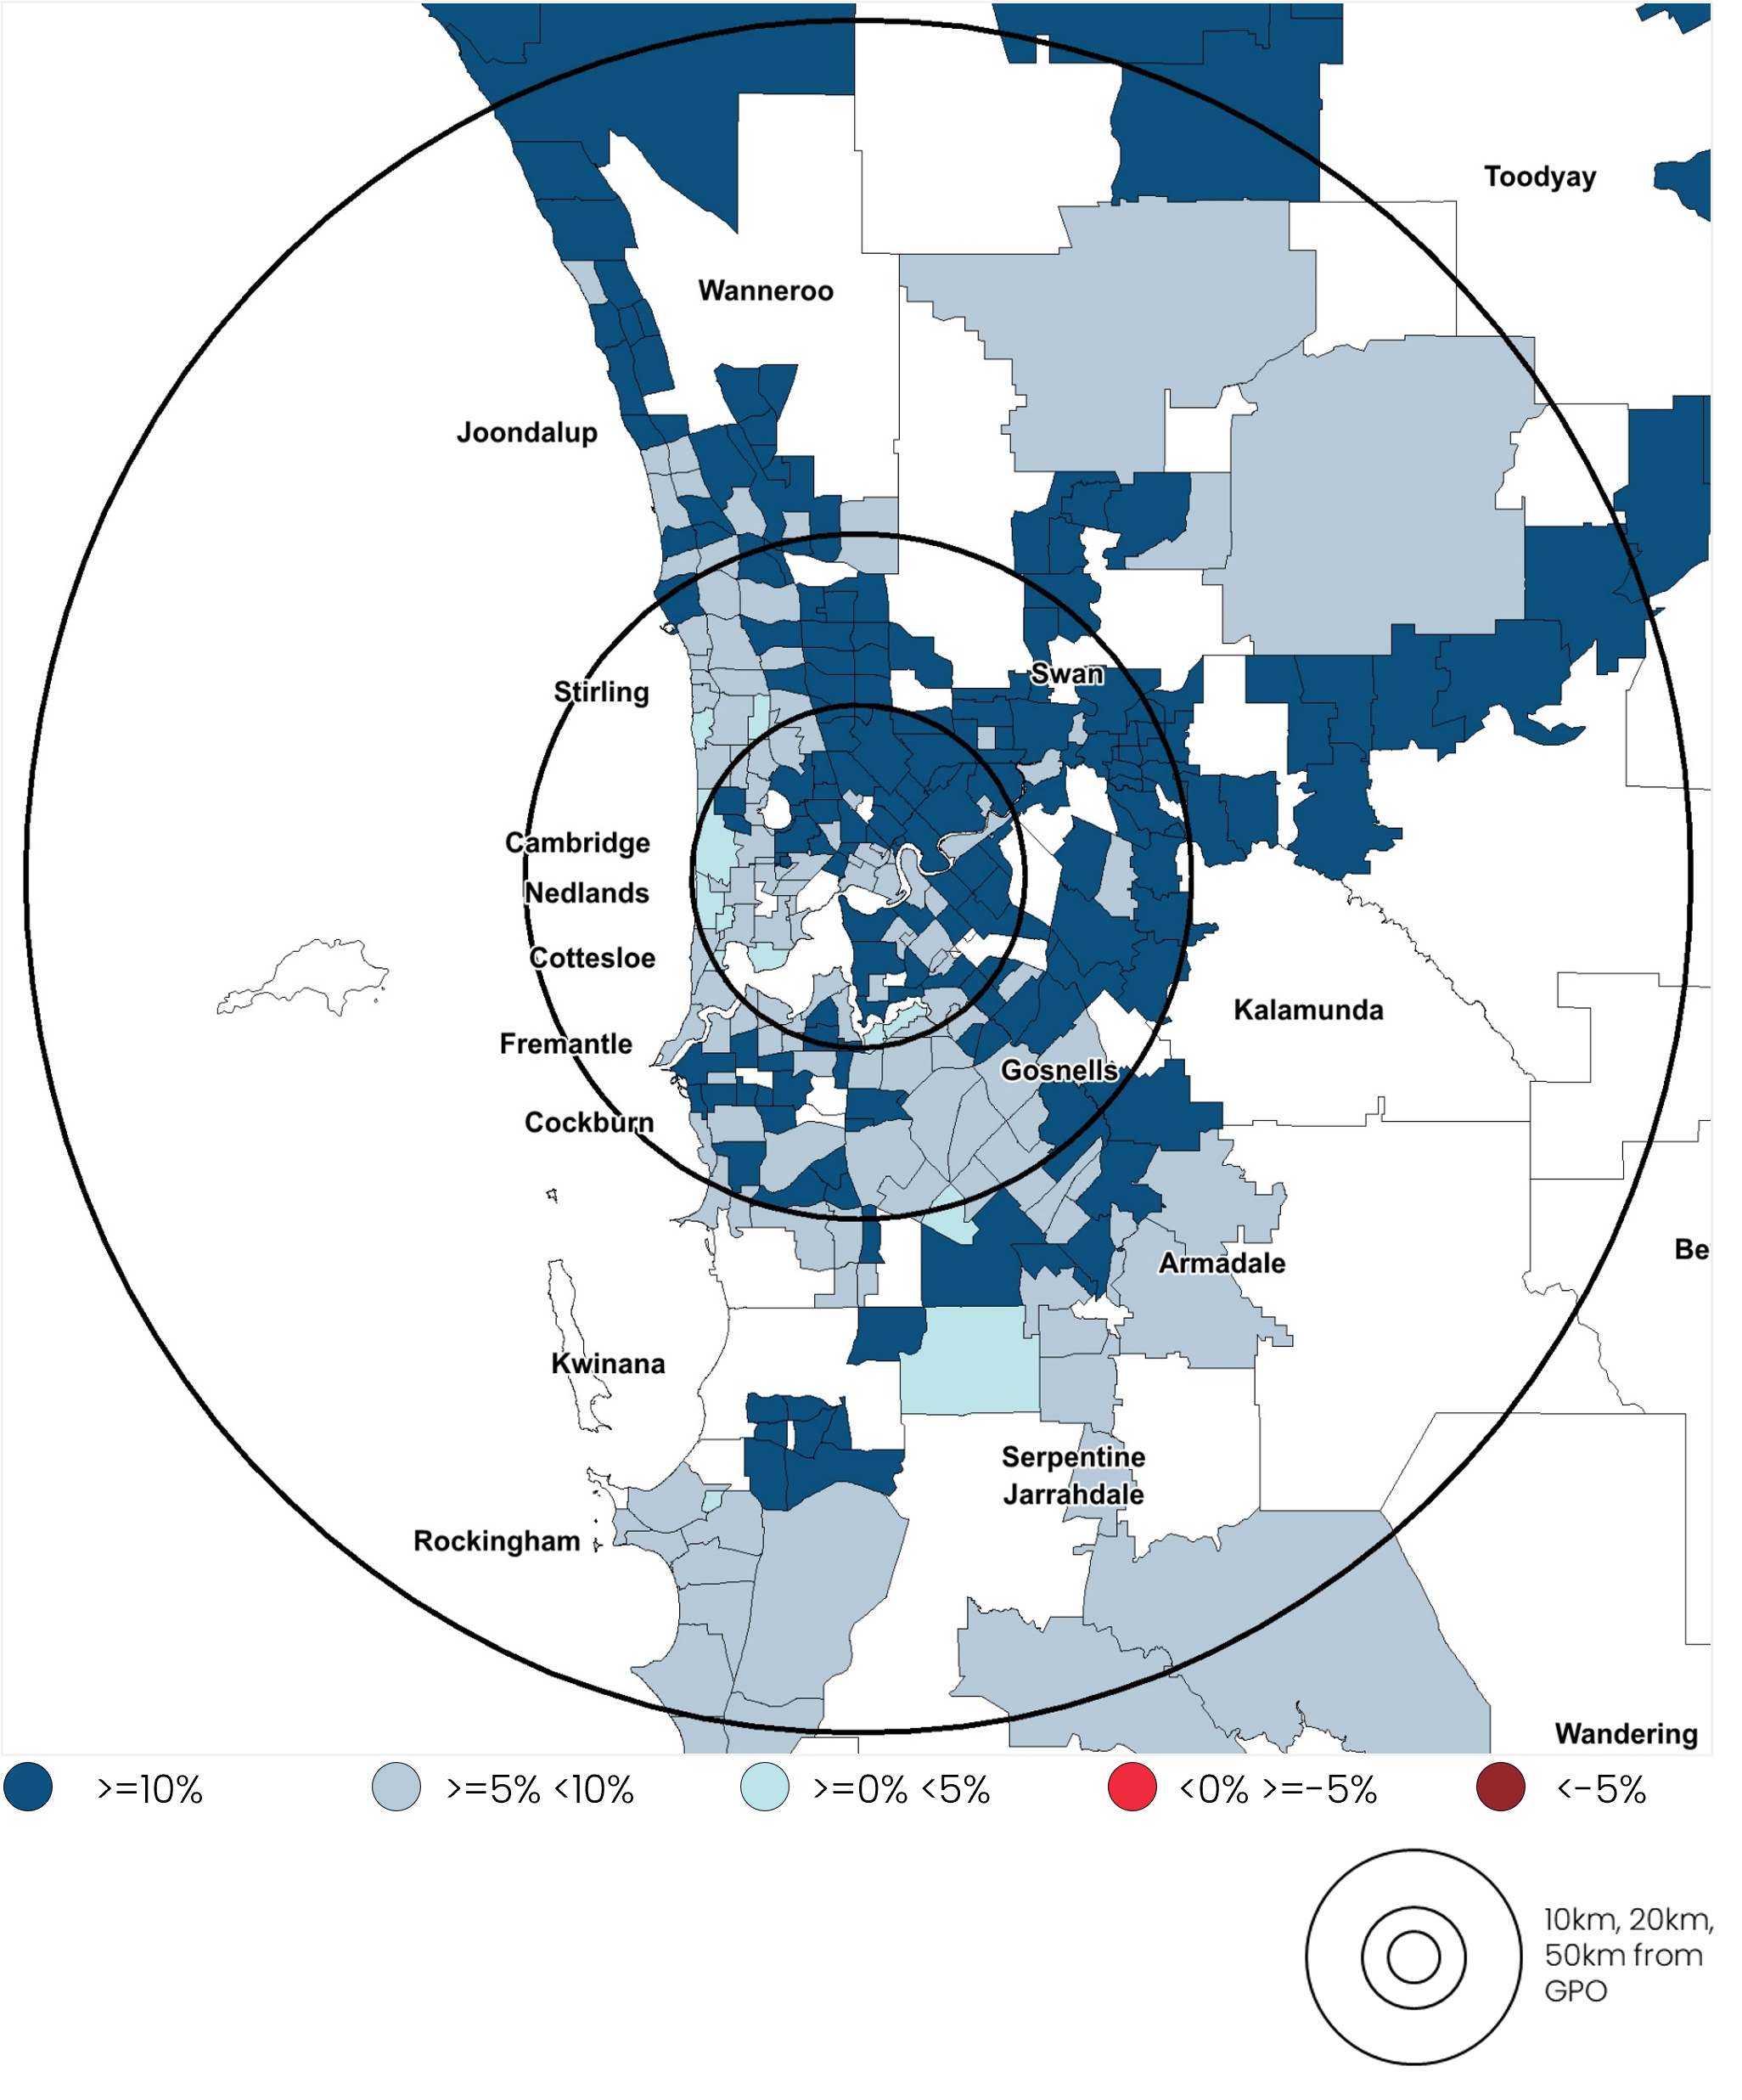
Perth
Perth’s lower quartile of home values have recorded double the level of growth than the upper quartile over the past 12 months, up 15.4% and 7.7% respectively. 15 of the top 20 highest growth suburbs over the past 12 months were located at least 15km form the Perth GPO, and only one suburb in the top 20 was within 10km of the GPO. Swan (7 suburbs in the top 20) and Mundaring (4 suburbs) LGAs accounted for the largest share of high-growth suburbs.
Change in dwelling values, 12 months to April 25
Median income no longer buys the median home
Mr. Lawless said the latest data underscores a structural shift in buyer behaviour driven by the fact that the median income no longer buys the median home.
“In theory, a household on a median income, with a 20% deposit, would need to dedicate just over half of their gross income to afford a median-priced home.”
“In practice, that’s pushing buyers further out, where homes remain comparatively affordable. The result is that we’re seeing outer suburban markets do much of the heavy lifting in terms of price growth.”
He said this geographic tilt towards the fringe has implications for infrastructure, transport and planning, as populations in these areas grow rapidly off the back of housing demand.
Highlights from the May 2025 Housing Chart Pack include:
- CoreLogic estimates the combined value of residential real estate rose to $11.3 trillion in March.
- National home values rose 0.7% over the rolling quarter, with the capitals up 0.5% and the regions up 1.4%.
- CoreLogic estimates there were 42,553 sales nationally in March, taking the rolling 12-month count to 528,212. While -2.1% below the recent peak record in December (539,743), the annual measure is up 4.6% compared to last year, and 4.1% above the previous five-year average.
- Properties are staying on the market longer, with the national median time to sell increasing from 30 days a year ago to 40 days in Q1 2025.
- After expanding through the second half of 2024 and into 2025, median vendor discounting rates tightened slightly over the three months to March to -3.5%.
- The rolling 12-month change in national rental values has continued to lose momentum, with rents up 3.8% over the year to March. The lowest annual change in rents in four years, this month's reading is just 1.8 percentage points above the pre-COVID decade average of 2.0%.
CoreLogic Australia