CoreLogic’s national Home Value Index (HVI) posted a 0.6% gain in February, the 17th consecutive monthly increase in the national HVI. While housing values are generally rising, the pace of growth in the national index has trended downwards since April last year.
February’s growth of 0.6% marks the lowest monthly growth reading since October 2020 and is down from 1.1% in January and a cyclical peak of 2.8% in March 2021.
According to CoreLogic’s director of research, Tim Lawless, every capital city and broad ‘rest of state’ region is now recording a slowing trend in value growth, albeit with significant diversity.
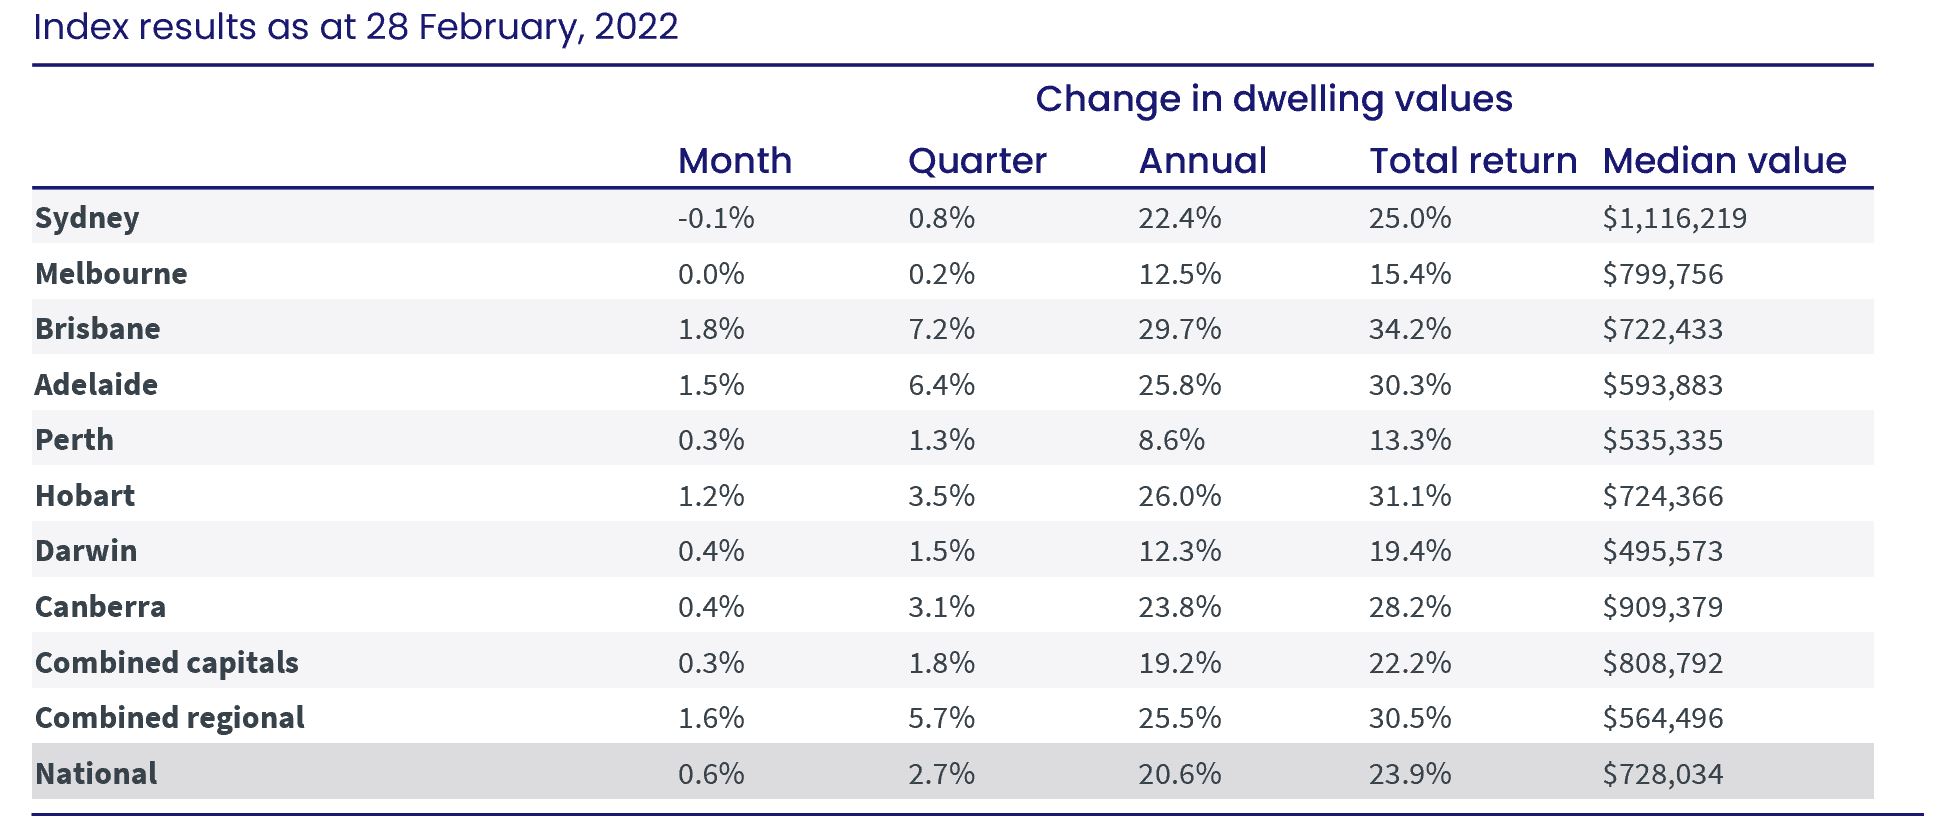
“Sydney and Melbourne have shown the sharpest slowdown, with Sydney (-0.1%) posting the first decline in housing values since September 2020, while Melbourne housing values (0.0%) were unchanged over the month, following similar results in December (-0.1%) and January (+0.2%),” he said.
“Conditions are easing less noticeably across the smaller capitals, especially Brisbane, Adelaide and Hobart, where housing values rose by more than 1% in February. Similarly, regional markets have been somewhat insulated to slowing growth conditions, with five of the six rest-of-state regions continuing to record monthly gains in excess of 1.2%.”
The stronger housing market conditions in Brisbane and Adelaide can be seen in the quarterly growth figures, with Brisbane housing values rising 7.2% over the past three months to February, while Adelaide is up 6.4% over the same period. At the other end of the capital city growth spectrum, Melbourne values are 0.2% higher over the past three months while Sydney values have risen by 0.8%.
With the trend in housing values losing pace over the past 11 months, the annual growth trend turned in February. Nationally, home values were 20.6% higher over the past 12 months, down from what is likely to be the peak rate of annual growth recorded at 22.4% last month.
Regional Australia continues to record a substantially higher rate of growth than the capital cities. Over the past three months, housing values across the combined rest-of–state regions increased at more than three times the speed of housing values across the combined capital cities; 5.7% and 1.8% respectively.
Although the rolling quarterly rate of value growth remains rapid across regional Australia, conditions have eased from a recent peak of 6.4% over the December quarter and is down from a cyclical peak of 6.6% recorded in April last year.
“Regional housing markets aren’t immune from the higher cost of debt as fixed-term mortgage rates rise. These markets are also increasingly impacted by worsening affordability constraints as housing prices consistently outpace incomes. However, demographic tailwinds, low inventory levels and ongoing demand for coastal or treechange housing options are continuing to support strong upwards price pressures across regional housing markets,” Mr Lawless said.
“The slower growth conditions in Australian housing values goes well beyond the rising expectation of interest rate hikes later this year,” Mr Lawless noted.
“The pace of growth in housing values started to ease in April last year, when fixed-term mortgage rates began to face upwards pressure, fiscal support was expiring and housing affordability was becoming more stretched. With rising global uncertainty and the potential for weaker consumer sentiment amidst tighter monetary policy settings, the downside risk for housing markets has become more pronounced in recent months,” Mr Lawless said.
Advertised inventory levels help explain the divergence in housing growth trends.
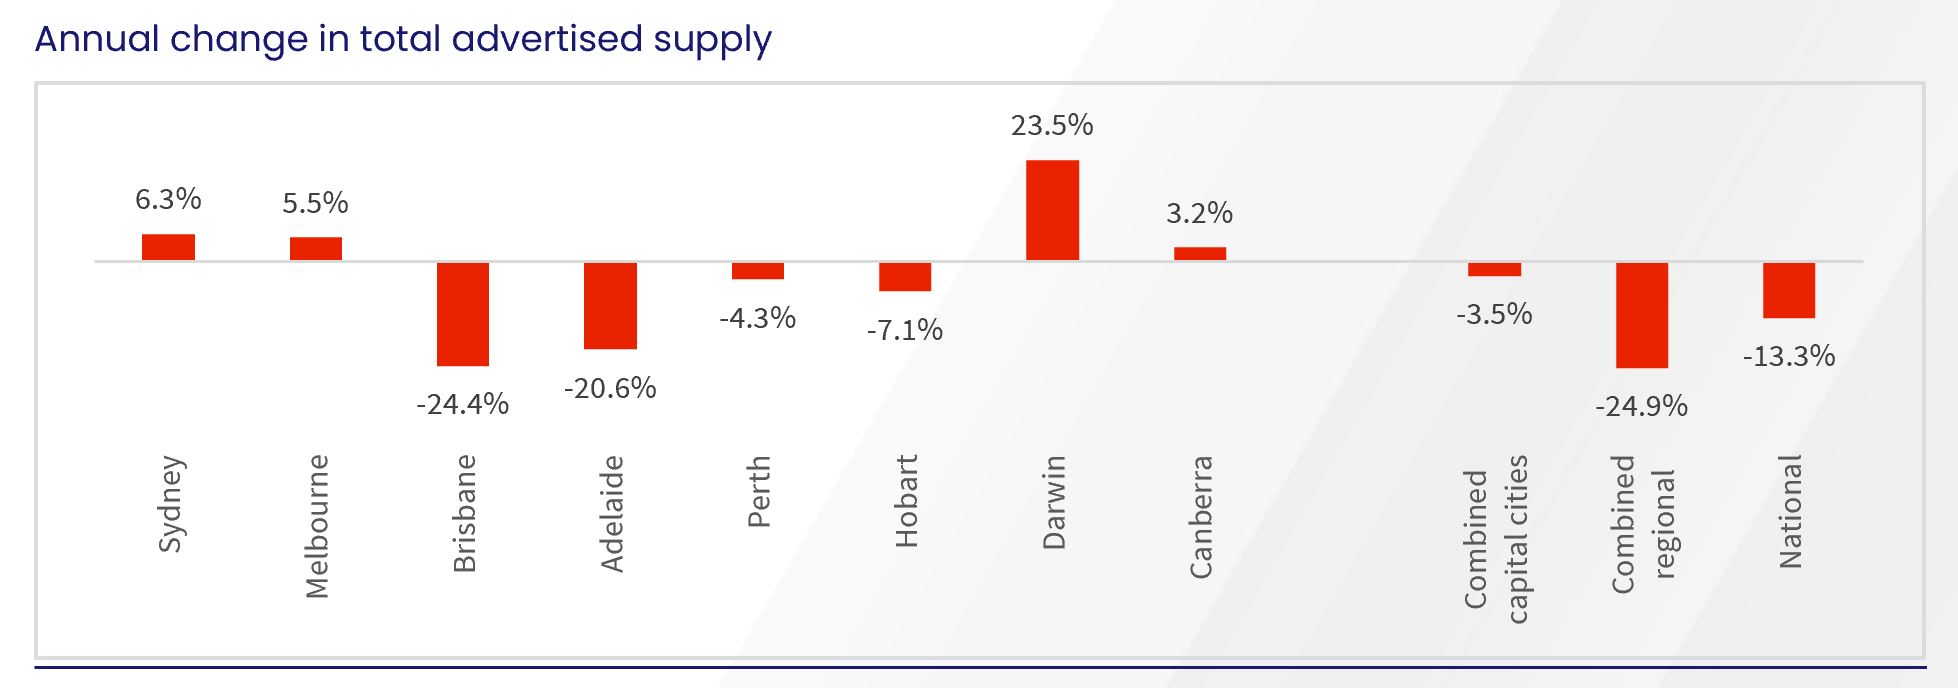
Nationally, the total number of properties advertised for sale over the four weeks ending 27 February was 13.3% lower than the same period a year ago, demonstrating an ongoing shortage of available housing to purchase, at least at the macro-level. Despite the low total listing count, advertised supply levels are gradually normalising after tracking close to 25% below the prior years’ level before spring 2021.
While some cities, such as Melbourne and Sydney, have seen advertised stock return to more normal levels, other Australian capitals are continuing to record extremely low inventory.
In Melbourne advertised stock levels are now above average, tracking 5.5% higher than a year ago and 4.7% above the previous five-year average. The trend is similar but not quite as advanced in Sydney, with total advertised stock 6.3% higher than last year but still 4.2% below the previous five-year average.
Mr Lawless said more choice translates to less urgency for buyers and some empowerment at the negotiation table.
“The cities where housing values are rising more rapidly continue to show a clear lack of available properties to purchase. Total listings across Brisbane and Adelaide remain more than 20% lower than a year ago and more than 40% below the previous five-year average.
Similarly, the combined rest-of-state markets continue to see low advertised supply, 24.9% below last year and almost 45% below the five-year average,” he said.
The trend towards higher overall stock levels in some cities can be attributed to a combination of more newly listed properties coming to market coupled with a softening in demand caused by worsening affordability, higher mortgage rates and lower levels of housing-related sentiment. The flow of newly listed properties was 11.3% higher than a year ago in February and 1.7% above the previous five-year average.
The pace of rental growth has shown a subtle rebound over the past two months, which can partially be attributed to the seasonal strength in rental markets through the first quarter of the year. Nationally, CoreLogic’s rental value index, which utilises a hedonic regression methodology similar to the HVI, was up 0.8% in February, holding firm from January (0.8%) and up from the 0.6% growth recorded in December.
The February rise in rents was focused within the unit market with the national unit rental index up 0.9% over the month and 2.4% higher over the rolling quarter compared to +0.7% and 2.0% for houses respectfully. According to Mr Lawless, this stronger trend in unit rents is most visible in Sydney and Melbourne.
“Anecdotally, demand for unit rentals in these cities has been bolstered by a combination of worsening rental affordability deflecting more demand towards the higher density sector, where rents tend to be lower, and demand starting to return from overseas arrivals,” he said.
With the pace of growth in housing values softening while rental growth holds reasonably firm, the gross yield profile has finally stabilised at 3.2%, the lowest rate on record. Sydney (2.4%) and Melbourne (2.8%), which have the lowest yield profiles, recorded a slight strengthening in gross yields this month, as rental growth nudges higher than growth in housing values. According to Mr Lawless, we could be seeing rental yields moving through the bottom of their cycle.
“After several years of yield compression where gross rental yields reached historic lows across most of Australia’s capital cities, we are finally seeing early evidence of yield repair. If rents continue to rise faster than housing values, which is a strong possibility in Sydney and Melbourne, yields will continue to improve.
“Cities such as Brisbane and Adelaide, where housing values are still consistently rising faster than rents, are likely to see yields compress to new record lows. Despite the downwards trend, yields in these cities remain well above Sydney and Melbourne levels,” Mr Lawless said.
Access to the Home Value Index is free and available to download here.
CoreLogic Australia