The global pandemic has catalysed remarkable shifts in the Australian housing market. From the temporary shutdown of cities, to an unprecedented monetary policy strategy, a new-found popularity of regional and low-density housing preferences and the introduction of various government home buying incentives, the COVID-period has had distinct impacts on the composition of buyers and the dynamics of the housing market.
Here I explore six of the major impacts on the Australian housing market two years on.
1. Australian home values rose 25%, to record highs.
Despite an initial dip, housing values rose 24.6% between the end of March 2020 and February 2022. Figure 1.0 shows the cumulative change in the national CoreLogic Home Value Index since the onset of COVID-19. The index had a relatively small decline at the onset of COVID-19, with sales and listings volumes being far more impacted than prices. National home values declined -2.1% between April 2020 and September 2020, before soaring amid low interest rates, high household savings, government grants and a sharp reduction in the supply of housing.
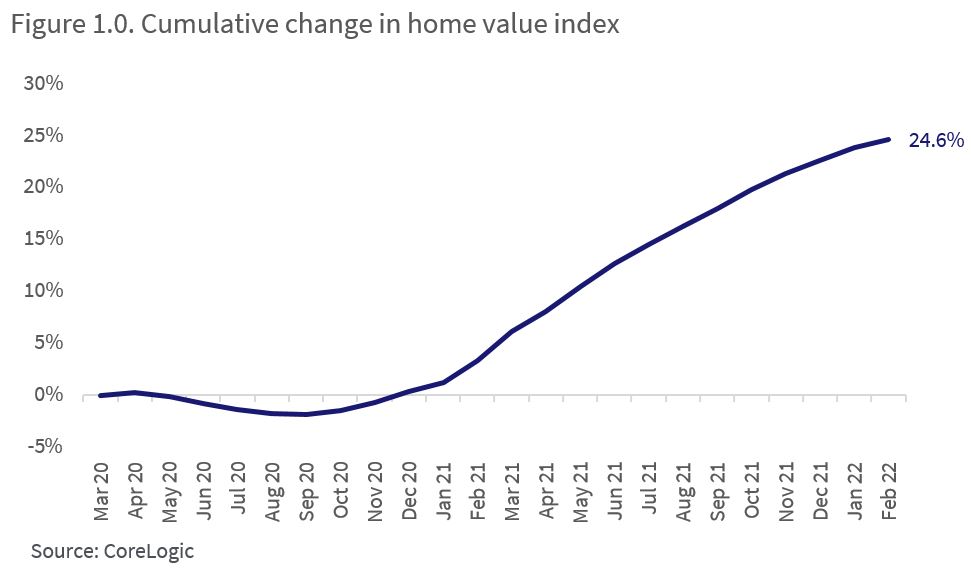
By February 2022, CoreLogic estimated the total value of residential real estate to be $9.8 trillion, up from $7.2 trillion at the onset of the pandemic. The median Australian dwelling value increased $173,805, to $728,034.
2. First homebuyer activity spiked.
First homebuyers were a sizable part of housing demand at the start of the pandemic. This cohort took advantage of more affordable housing options following the earlier downturn, along with record low mortgage rates and government incentives.
ABS data shows the number of new loans to first homebuyers increasing during the housing market downswing from 2017 to 2019 (figure 2.0). From June 2020, first home buyer activity surged amid the introduction of the HomeBuilder scheme, used alongside the First Home Loan Deposit Scheme, as well as other state-based grants and stamp duty concessions for first homebuyers.
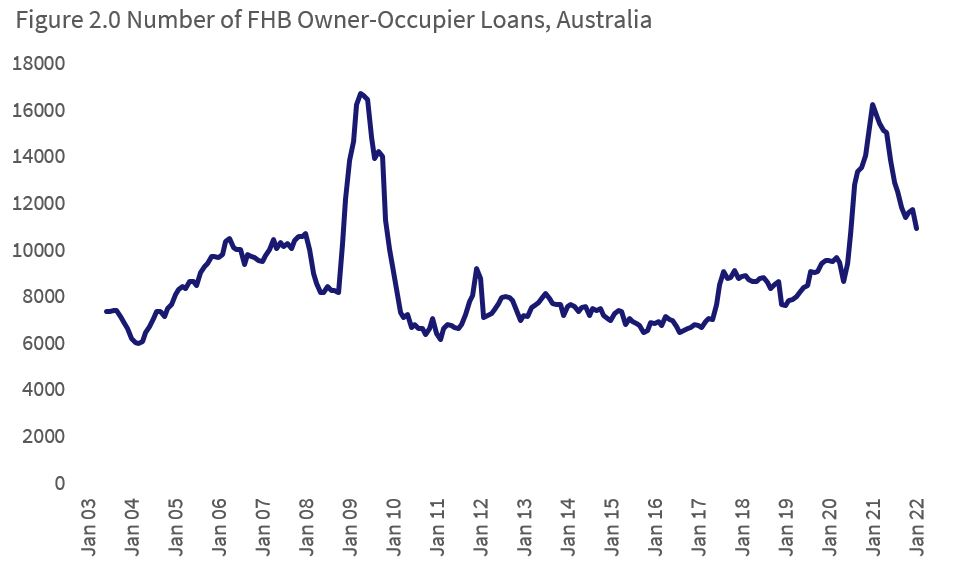
The result was a spike in first homebuyer activity, which peaked in January 2021. The spike mirrors first homebuyer participation in 2009-10, which marked a temporary boost to the First Homeowner Grant. Since the January 2021 peak, first home buyer activity has diminished, reflecting higher barriers to entry as housing values substantially outpace incomes.
As of January 2022, loans to first homebuyers numbered 10,964, above the decade average of 8,682. Proportionally, first homebuyer lending comprised 24% of owner occupier mortgage demand in January, which is in-line with the decade average.
This may have implications for rates of home ownership, which may see an increase on ABS 2016 census numbers. While the rise in home values has created a greater deposit hurdle for those looking to enter the market, various government schemes introduced throughout 2020 helped to incentivise first homebuyer participation.
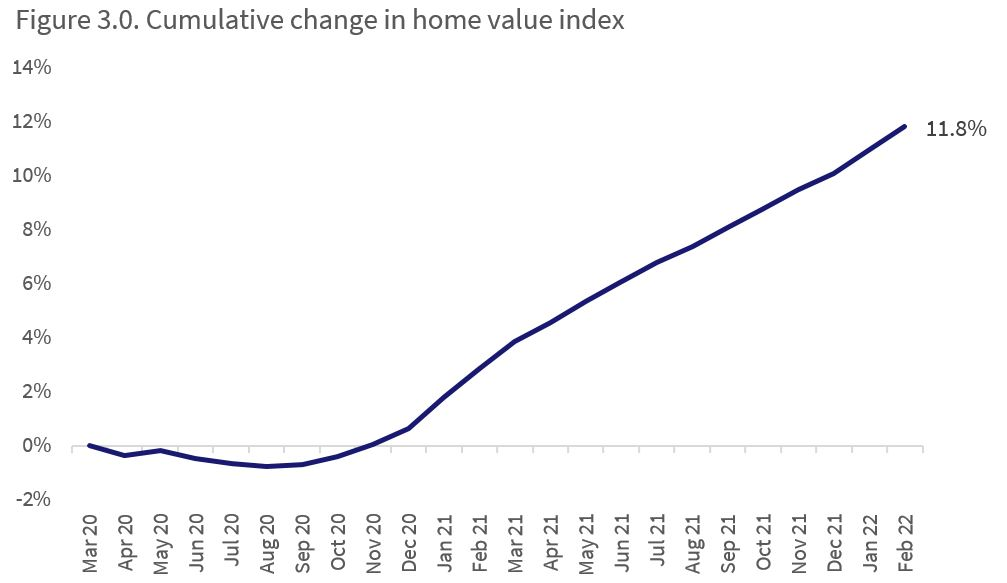
3. Rents rose 11.8% to record highs, while gross yields fell to record lows.
The CoreLogic Rent Value Index, which tracks changes in rental valuations over time, has also surged to new record highs.
Figure 3.0 shows the change in the national rent index since the end of March 2020. While rents saw a mild decline of -0.8% between March and August 2020, there was a swift recovery in these values, followed by a surge through 2021.
There are multiple reasons rents have risen. Investor activity had been relatively subdued between 2017 and mid-2020, contributing to rental supply constraints. Rental supply may also have been eroded through the rise of rental services like Airbnb, which have enabled property owners to pivot to the short-term rental accommodation market. This latter trend may have been particularly prevalent in tourism destinations across Australia, some of which have flourished amid a rise in domestic tourism in the past two years. For investors who have recently purchased long-term rental accommodation, rents may have increased due to higher purchasing prices.
Over the course of 2021, annual rent value growth was at its highest levels since 2008. Across Australia, median advertised rents since March 2020 have increased $30 per week to $470 per week. The headline numbers hide the diversity of rental conditions. Through the pandemic, there has been a clear shift in rental preferences towards lower density housing options, where the upwards pressure on rents has been more substantial. This trend has evolved over the past year, with rental affordability gradually deflecting more demand towards higher density rental options where the cost of renting is more affordable.
However, gross rental yields have declined. This is because gross rental yields are a portion of the purchase price of a property, and purchase prices of properties have grown 24.6% since March 2020, outpacing the 11.8% rise in rents. Nationally, gross rental yields have fallen from 3.8% at March 2020 to a record low 3.21% as of February 2022. As housing growth has started to slow, this record-low gross rent yield figure appears to have begun stabilising.
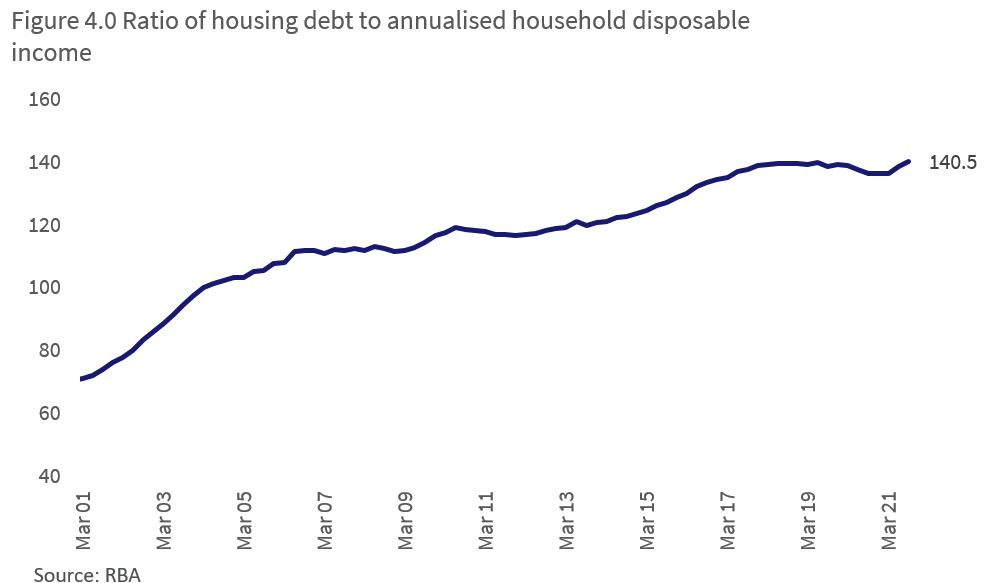
4. Housing debt levels hit record highs.
Rapid increases in housing and rent values in the past two years was largely the result of a sizable reduction in the official cash rate. With the RBA setting the official cash rate target at 0.1% since November 2020, lower debt costs enabled borrowers to access more credit.
As of January, total outstanding housing credit sat at a record high of over $2 trillion, according to the RBA, while the ratio of housing debt to household income was at a record high 140.5% through Q3 2021 (figure 4.0). This is up from 139.2% in March 2020.
While total outstanding credit reached over $2 trillion in January, ABS data shows monthly new finance borrowed for the purchase of property continued to hit fresh record highs through January 2022, at $33.7 billion.
High levels of housing debt, particularly where it has grown faster than incomes, creates a vulnerability in the Australian economy. However, it is important to frame debt levels in the context of high asset values, and relatively low interest costs. RBA data shows housing interest payments to income have fallen to their lowest levels since 1999, and household debt has trended lower as a portion of housing values.
5. The premium of house prices compared to units hit record highs.
Both the composition of the buyer pool and the impacts of COVID may have contributed to a record gap between house and unit values. Investors, who may have a preference for units, have been a relatively small part of demand through the upswing. Additionally, detached houses may have been in higher demand as Australians spent more time at home through the pandemic. Government policies such as the HomeBuilder grant may have also contributed to increased detached housing demand, due to tight construction timelines to qualify.
The result is a record high gap between house and unit values. Figure 5.0 shows the median house value across Australia was at a record high 29.8% above the median Australian unit value, with a dollar value premium of around $182,000. This is up from just 8.5% in March 2020, or a dollar value premium of around $44,000 for houses.
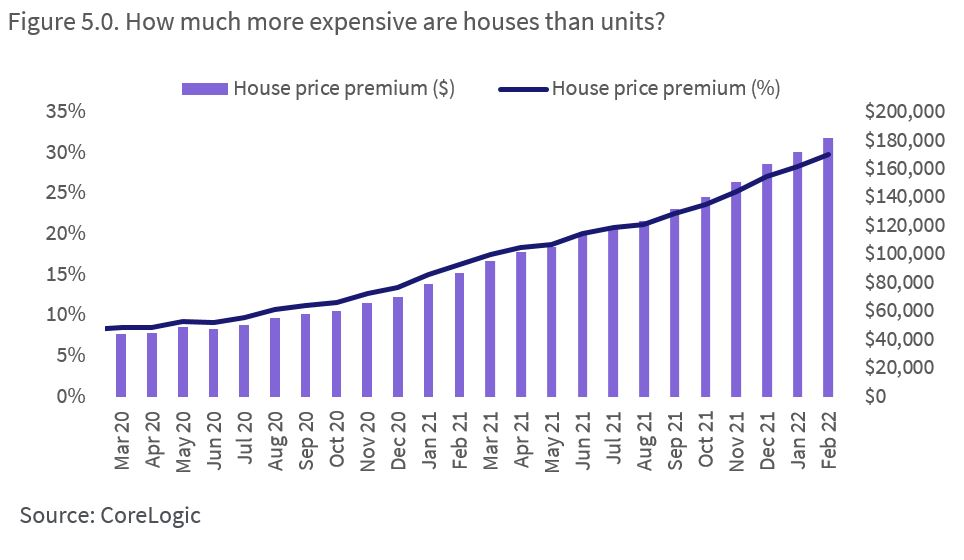
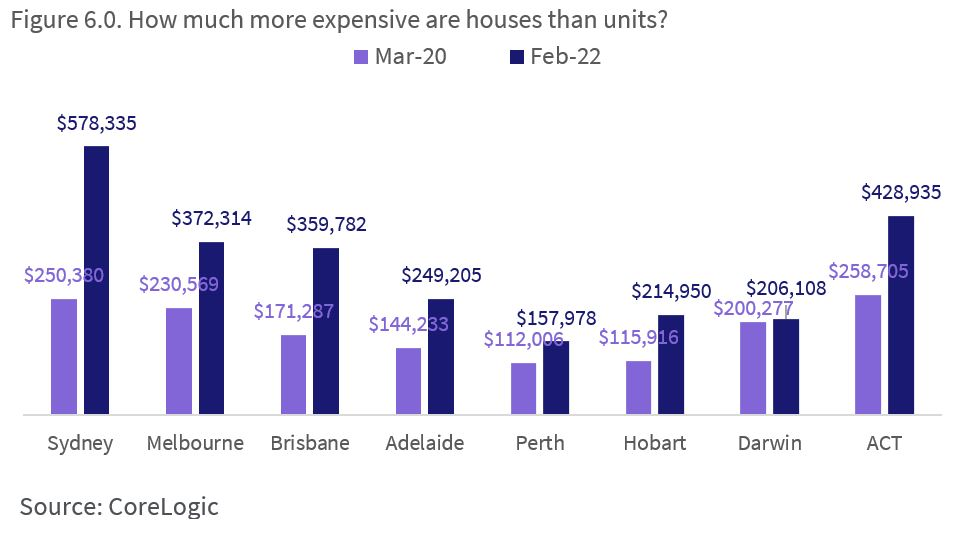
Figure 6.0 shows the dollar-value premium of median house values over median unit values in each of the capital cities, with most cities seeing a substantial increase in this value since March 2020.
6. The rise of the regions.
Migration trends over 2020 and 2021 revealed an uptick in the volume of people leaving cities for regions outside of lockdown periods, and a decline in people leaving regions for cities.
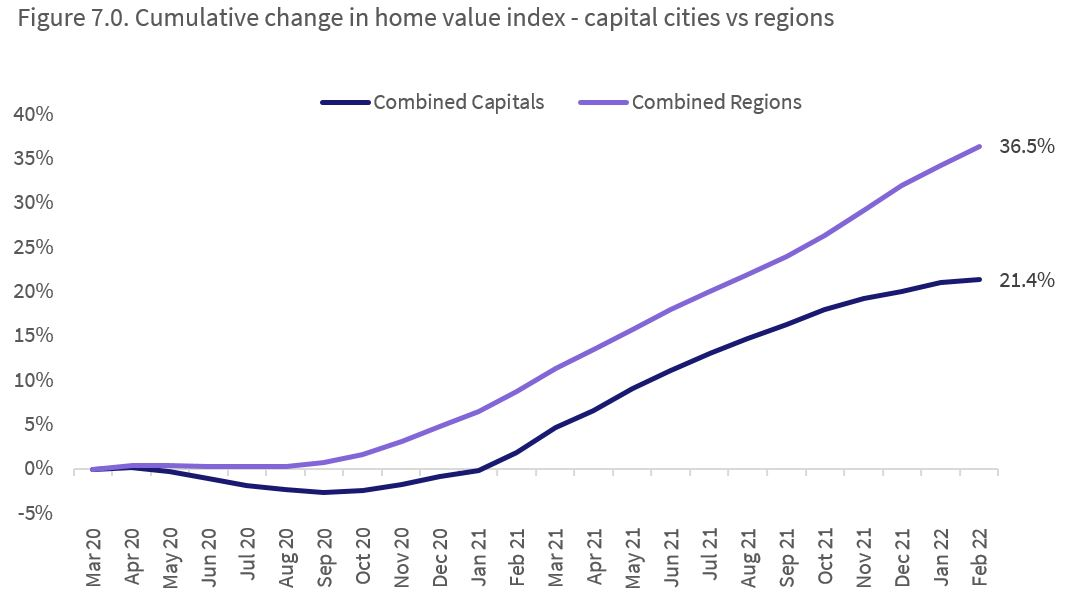
The result has been higher than normal housing demand against unusually low levels of listings across regional Australia, in both the sales and rental market. Value gains across regional Australian dwelling values has been almost 40% since March 2020, while capital city home values have increased around 21% (figure 7.0).
In lifestyle regions, which have become intensely popular in the past two years, new million-dollar markets have been created across areas such as the Sunshine Coast, the Illawarra and the Gold Coast, where median house values now sit above the million dollar mark.
Where to from here?
The current housing market upswing has delivered extraordinary value gains, providing a significant wealth boost for home owners, but larger hurdles to enter the market for non-home owners. But since April of 2021, monthly gains in national home values have softened. Arguably, there are more headwinds than tailwinds now stacked against continued growth in the property market, with the potential for sooner-than expected cash rate increases, affordability constraints, and weakening consumer sentiment slowing demand. While some structural shifts through the pandemic, such as remote work, may sustain demand in regional Australia long term, it is likely that housing values will start to decline on a fairly broad basis later this year.
To receive the latest CoreLogic data and insights straight to your inbox each week, subscribe to our free Property Pulse e-newsletter.

Meet Eliza Owen
Head of Residential Research Australia
Eliza Owen was appointed the Head of Research at CoreLogic Australia in 2020.
Full profile