Overview
CoreLogic’s Monthly Housing Chart Pack delivers timely, detailed insights into the fundamentals that are affecting the residential property market.
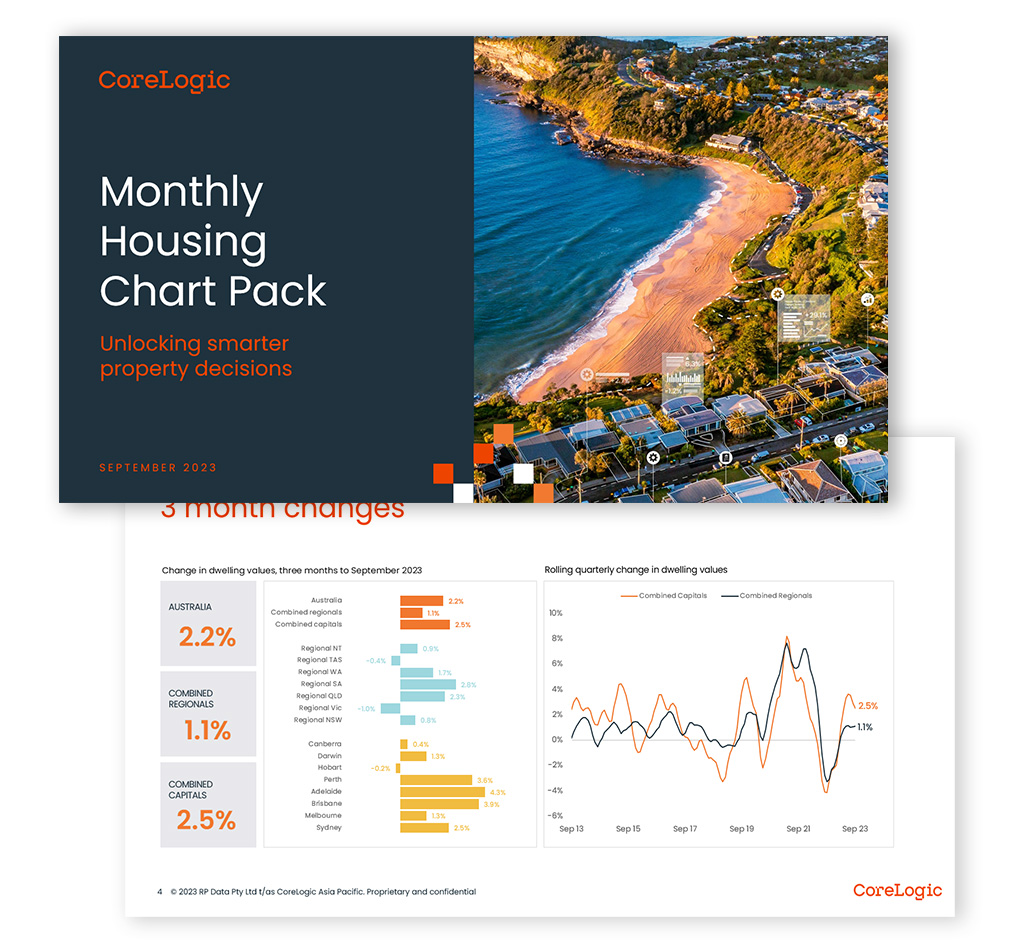
This comprehensive benchmarking report analyses a range of metrics including property value growth, sales volume, time on market and rental growth. Detailed charts are included in the report, making it essential reading for all property-related and finance professionals seeking a complete overview of capital housing markets. The monthly chart pack comprises a timely series of graphics and data for the national housing market performance over the reporting month.
Download the free report
What is included?

Asset values
The report summarises a range of Australian asset class values and how residential real estate compares to other mainstream investments

Market insights
Commentary and analysis of the growth trends based on the daily hedonic index movements allows for quality market analysis across capital city and regional markets

Wide-ranging metrics
Valuable data points into national sales and listings volumes, rental yield and rental price movements, vendor discounting and days on market provide a 360-degree market view

National overview
Charts extend to clearance rates, building approvals data for houses and units and the state of housing finance, mortgage rates and first home buyer participation