Consecutive rate hikes, low sentiment and reduced lending capacity continue to weigh heavily on housing demand as declining unit values become more widespread.
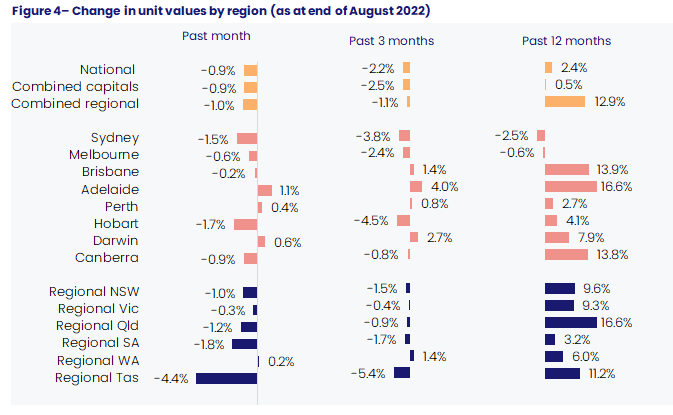
Since peaking in April, CoreLogic’s national unit index has decreased by -2.3%, with values declining by approximately $14,400 over the past four months. Making up 78.3% of Australia’s unit supply, the combined capitals recorded a larger decline in unit values relative to the regional areas, falling -2.7% or around $17,500 since April. By comparison, regional units, with a more affordable median value (approximately $110,000 below the capitals), have been somewhat more resilient, with values falling -1.3% since peaking in June, equivalent to approximately -$7,000. As we continue to move through the downward phase of the cycle, we can start to understand how the current downswing compared to previous periods of value decline.
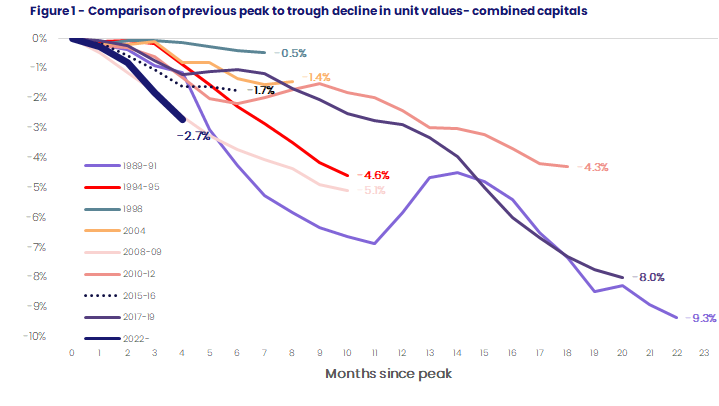
Figure 1 compares the current cumulative decline in unit values across the combined capitals to previous peak-to-trough declines on a month since peak basis. With capital city unit values falling -0.9% in August, the current downswing has now overtaken the pace of decline seen at the onset of the Global financial crisis (GFC), to be the fasted decline in unit values in 40 years.
CoreLogic Economist Kaytlin Ezzy says “The current tightening cycle has seen the cash rate rise 2.25% in just five months, the fastest increases seen since 1994. While Australia’s unit market has been somewhat more resilient to falling values than the detached housing segment, it has not been immune, with many households being sensitive to increased interest rates due to high debt levels along with high inflation.”
“Despite the current decline being the fastest on record, it’s important to remember the context of the past two years. While capital city unit values are just 0.5% higher than this time last year, they are still 7.7% above pre-COVID levels.”
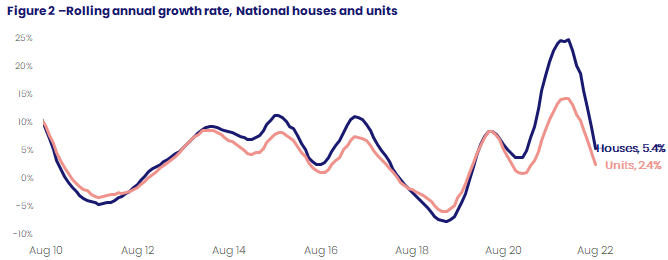
Across the combined capitals, the annual performance gap between houses and units has narrowed, from 12.3 percentage points in September 2021 to just 2.2 percentage points in August, while the national performance gap has fallen from 10.9 percentage points to 3.0 percentage points over the same period.
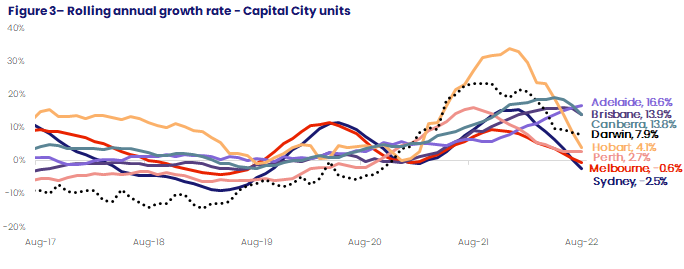
Looking across the individual capitals, Hobart and Sydney recorded the largest monthly declines in unit values, falling -1.7% and -1.5% respectively, while values across Melbourne declined by -0.6%. The cumulative decline in unit values seen has seen Sydney's (-2.5%) and Melbourne's (-0.6%) annual trend fall into negative territory for the first time since February 2021, while Hobart’s values have fallen -2.5% below the levels recorded at the beginning of the year.
As the rising cost of living and increased interest rates put further downwards pressure on demand, the declines initially seen across Sydney and Melbourne unit values are now becoming more widespread. Canberra’s medium to high-density sector recorded its second month-on-month decline, taking values -1.2% below the peak levels recorded in June, while Brisbane units saw values fall for the first time since October 2020, decreasing -0.2% over the month.
Unit listing levels across Canberra have continued to normalise over the past few months, which has put further downwards pressure on values.
Since the middle of May, Canberra’s total advertised supply has improved from -23.3% below the previous 5-year average to just -6.0% below average at the end of August
Over the same period, Brisbane listings levels have seen a milder increase, rising from -39.7% below average to -33.2% below average.
“Despite the monthly change in Adelaide’s house values falling into negative territory (down -0.2% in August), value growth across Adelaide’s medium to high-density market remain positive, with values up 1.1% over the month. While still recording positive monthly growth, the quarterly growth trend has eased further, from a peak rate of 4.9% over the June quarter to 4.0% over the three months to August,” noted Ms Ezzy.
The pace of quarterly growth across Perth has eased from 1.5% over the three months to May to 0.8% over the three months to August, while the quarterly trend in Darwin’s unit values has accelerated, rising from 1.0%, to 2.7% over the same period.
Similarly, the downward shift in values has continued to spread amongst the regional markets, with only Regional WA recording a small rise in unit values over the month (0.2%). Across the individual SA4 regions, nine of the 23 regional SA4’s analysed are now seeing unit values fall over the quarter. Units across Queensland’s Sunshine Coast recorded the largest quarterly decline, down -5.5%, followed by Richmond- Tweed (4.4%) in NSW.
“Listings continue to be an important factor affecting values. Limited supply across Adelaide has helped support value growth while above average listing levels in Sydney and Melbourne have contributed to skewing selling conditions in favour of buyers.”
Ms Ezzy says, “Despite the variance across the individual capitals, listing levels across the combined capitals have held relatively steady over the four weeks to the 28th of August. As we move further into spring we would typically expect to see a rise in freshly advertised stock. If a rise in listings isn’t met with a subsequent rise in demand we could see a glut in supply, which would add additional downward pressure on values.”
For more information and analysis on unit listings, rents, yields and overall performance, download the complete September Unit Market Update.
Download the September Unit Market Update

Meet Kaytlin Ezzy
Economist
Kaytlin Ezzy is an Economist at CoreLogic, Australia’s leading property data, information, analytics and services provider.
Full profile