The geographic scope of Australia’s housing downturn broadened through October with every capital city and rest-of-state region (apart from regional South Australia) recording a drop in housing values last month.
CoreLogic’s national Home Value Index (HVI) moved through a sixth month of consistent declines, as values fell a further -1.2% in October.
Across the capital cities the month-on-month decline ranged from a -2.0% fall in Brisbane to Perth where dwelling values nudged -0.2% lower. Across the rest-of-state regions, monthly falls of more than -1% were recorded in Regional NSW (-1.7%), Regional Victoria (-1.4%) and Regional Queensland (-1.3%).
Although more regions are recording a fall in housing values, the rate of declines remain diverse. The pace of falls has eased over the past two months across Sydney and past three months in Melbourne but has gathered momentum in Brisbane where home values are now falling the most rapidly of any capital city or rest-of-state region. The changing dynamic across the largest cities has seen the rate of decline across the combined capitals index ease from a -1.6% drop in August to -1.4% in September and -1.1% in October.
CoreLogic’s Research Director, Tim Lawless said it is probably still too early to claim the worst of the decline phase is over.
“Despite the easing in the pace of decline, with Australian borrowers facing the double whammy of further interest rate hikes along with persistently high and rising inflation, there is a genuine risk we could see the rate of decline re-accelerate as interest rates rise further and household balance sheets become more thinly stretched,” he said.
“To-date, the housing downturn has remained orderly, at least in the context of the significant upswing in values. This is supported by a below-average flow of new listings that is keeping overall inventory levels contained. There’s also tight labour market conditions, an accrual of borrower savings and a larger than normal cohort of fixed interest rate borrowers, who have so far been insulated from the rapid rise in interest rates.”
Housing values across most of the broad regions remain well above pre-COVID levels, implying most home owners remain in a positive valuation position relative to their purchase price.
At the combined capital city level, housing values have fallen -6.5% following a 25.5% rise through the upswing. Sydney home values are down -10.2% since peaking in January (after a 27.7% rise) and Melbourne values down -6.4% since February (after rising 17.3%).
Across the 310 SA3 sub-regions analysed nationally (excluding areas with low sales or low confidence scores), only 16 regions remained at cyclical highs at the end of October, with a skew towards the more affordable areas of Perth and Adelaide and a mix of regional markets.
House values have continued to fall at a faster rate than unit values across most regions. Capital city house values were down -1.2% in October compared with a -0.7% decline in unit values. This underperformance across the lower density sector has been a feature of the downturn, partially offsetting the substantially larger rise in house values through the growth phase.
Through the upswing, capital city house values increased by 29.9% which was more than double the rise in unit values at 13.2%. Since peaking in April, capital city house values have reduced by -7.2% while unit values are down -4.2%.
Mr Lawless said the smaller decline in values across the unit sector can be attributed to the more affordable price points across the medium to high density sector.
“The gap between median house and unit values increased to record levels through the COVID upswing. With borrowing capacity being hit hard as interest rates rise, it’s likely more housing demand has been diverted towards more affordable sectors of the market,” he said.
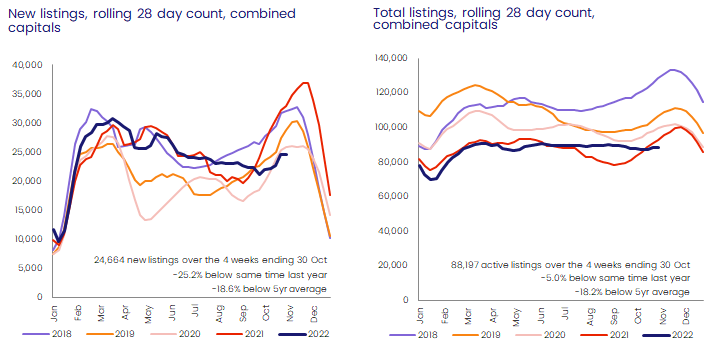
The flow of new listings started to trend higher in October, but the traditional spring selling season remains well below levels at the same time last year and relative to the previous five-year average. Over the four weeks ending October 30th, the number of newly listed capital city dwellings was tracking -25.2% below a year ago and almost -19% below the previous five-year average.
The trend in total advertised listings is holding relatively firm, tracking -5.0% below levels a year ago and -18.2% below the previous five-year average.
“Although we are now seeing a late spring response to freshly advertised supply, every capital city except Darwin is recording a lower than average flow of new listings added to the market over the past four weeks,” Mr Lawless said.
“The low number of freshly advertised properties is probably helping to contain price falls to some extent. So far we haven’t seen any evidence of panicked selling or forced sales.”
On the demand side, the estimated number of home sales has held reasonably firm through the first two months of spring. Based on modelled sales over the three months ending October, capital city home sales were -16.6% lower than a year ago and 3.8% above the previous five-year average for this time of the year.
“The number of home sales is well down from the highs of late last year, however the fact that sales activity is still above the five-year average over the past three months reflects a base level of demand remains for housing,” Mr Lawless said.
“Housing finance data shows subsequent buyers, such as upgraders, downsizers or movers, have been the most resilient sector of the market since interest rates started to rise. As interest rates rise further, it’s likely sales activity will also trend lower as borrowing capacity is reduced.”
Nationally rents rose another 0.6% in October led by a 1.1% rise in unit rents while house rents increased by 0.5%.
The trend towards higher rental growth across the unit sector is evident across most of the capital cities and rest-of-state markets. This demand for medium to high density styles of accommodation can probably be attributed to rental demand transitioning towards more affordable rental options such as units, along with the added demand from overseas migration which tends to favour inner city unit rents, especially in Melbourne and Sydney.
Unsurprisingly, Melbourne and Sydney are also recording the highest annual rental appreciation for units, with rents up 13.7% and 13.4% respectively over the past 12 months.
More broadly, the speed of rental growth has been slowing, with the rolling quarterly rate of national rental growth dropping from 3.0% over the three months ending May 2022 to 2.1% over the most recent three month period.
“A gradual slowdown in rental growth in the face of low vacancy rates could be an early sign that renters are reaching an affordability ceiling. Since the onset of COVID, capital city rents have risen 17.7% and regional rents are up 25.5%. Although rents are likely to continue to rise, it’s likely renters will be progressively seeking rental options across the medium to high density sector, where renting is cheaper, or maximising the number of people in the tenancy in an effort to spread higher rental costs across a larger household,” Mr Lawless said.
As rents continue to rise and dwelling values generally trend lower, gross rental yields remain on a rapid upwards trajectory. Capital city gross yields (3.43%) are now at the highest level since November 2020 after rising 47 basis points from the February 2022 record low. This was largely led by a 57 basis point rise in unit yields, while house yields rose by 43 basis points. Despite rising by a smaller 34 basis points since the April low, regional yields are substantially higher than gross yields across the combined capitals at 4.4% for houses and 3.4% for units respectively.
Download the October Home Value Index

Meet Tim Lawless
Executive, Research Director, Asia-Pacific
Tim is executive research director of CoreLogic’s Asia–Pacific research division, managing a team of economic and data specialists across Australia and New Zealand. He brings more than 20 years’ experience to the role, providing deep insights and analysis on national housing trends.
Full profile