CoreLogic Economist Kaytlin Ezzy takes a deep dive into the Brisbane and Northern Rivers property markets one year on from the devastating 2022 floods.
Following the one-year anniversary of the East Coast floods, the devastating impact that extreme weather events and climate change can have on people and property cannot be understated. Last year's weather events, described by some as a ‘rain bomb’ that saturated areas of South East Queensland and coastal NSW saw thousands of properties inundated, displacing many families and causing widespread damage to housing. The Insurance Council of Australia estimated an insurance cost of $5.7 billion, making this Australia's most costly natural disaster to date.
From a housing perspective, separating the impact to housing values from the flooding event as opposed to the broader housing downturn presents a challenge. However, by using satellite imagery and more granular property-level data, we can start to understand the impact this event has had on the Brisbane and Northern Rivers property markets.
Across the Northern Rivers
Property values across the Richmond - Tweed region recorded significant growth over the COVID period, with dwelling values surging 45.9% between March 2020 and February 2022. A lift in demand for housing in regional coastal and ‘lifestyle’ regions fuelled a 53.1% rise in Byron Shire dwelling values, with demand cascading through to more affordable local government areas, including Ballina and Lismore, up 51.0% and 25.1%, respectively through the recent growth cycle.
While value growth and transaction activity had already started to ease across the region prior to the floods, the property market upswing came to a screeching halt at the end of February 2022. Between the February and March flood events, approximately 13,100 residential properties across the Richmond – Tweed were inundated by flood or stormwater, impacting roughly 13.5% of the region's housing stock.
Using satellite imagery taken during the event, CoreLogic has identified flood impacted properties as a portion of housing stock across the Lismore (16.5%), Ballina (15.2%) and Byron (7.0%) LGA’s. At the suburb level, it's unsurprising that the flood-prone suburbs of South and North Lismore recorded the largest portion of impacted properties, at 80.8% and 70.1%, respectively, followed by West Ballina (56.0%), Lismore CBD (40.5%) and Ballina CBD (36.9%). With the highest flood level on record (14.4m) the Lismore peak saw properties in suburbs that had previously been considered a low flood risk go underwater. Girards Hill saw approximately 35.1% of properties impacted by flood water, while roughly 22.4% of properties in East Lismore were inundated. Across Byron, Mullumbimby (17.4%) recorded the largest portion of flood-impacted properties, followed by Ocean Shores (12.3%) and Central Byron Bay (6.7%).
Figure 1 – Portion of housing stock impacted by floods – Suburbs.
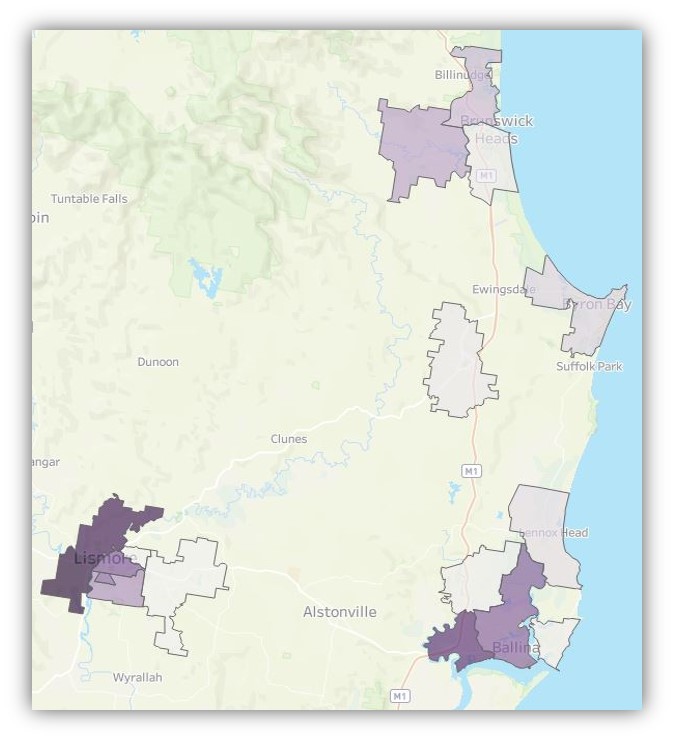
Figure 2 displays the change in the CoreLogic home value index across Richmond - Tweed's dwelling values from the end of February 2022 to current. The change across select flood-impacted suburbs is also displayed, where there were sufficient observations to track value over time. In the immediate aftermath of the flood, Richmond - Tweed's transaction and listing activity fell sharply. The ensuing three months saw sales activity drop -39.8% compared to the same period the year prior and -23.5% below the previous five-year average, while newly advertised listings fell -18.8% and -14.6%, respectively. The delay in flood-affected properties hitting the market saw values record a residual increase over March and April before recording a sharp decline in May (which also aligned with the first interest rate rise on May 3).
Figure 2 – Change in dwelling values from February 22 – Richmond Tweed region and select flood-impacted suburbs.
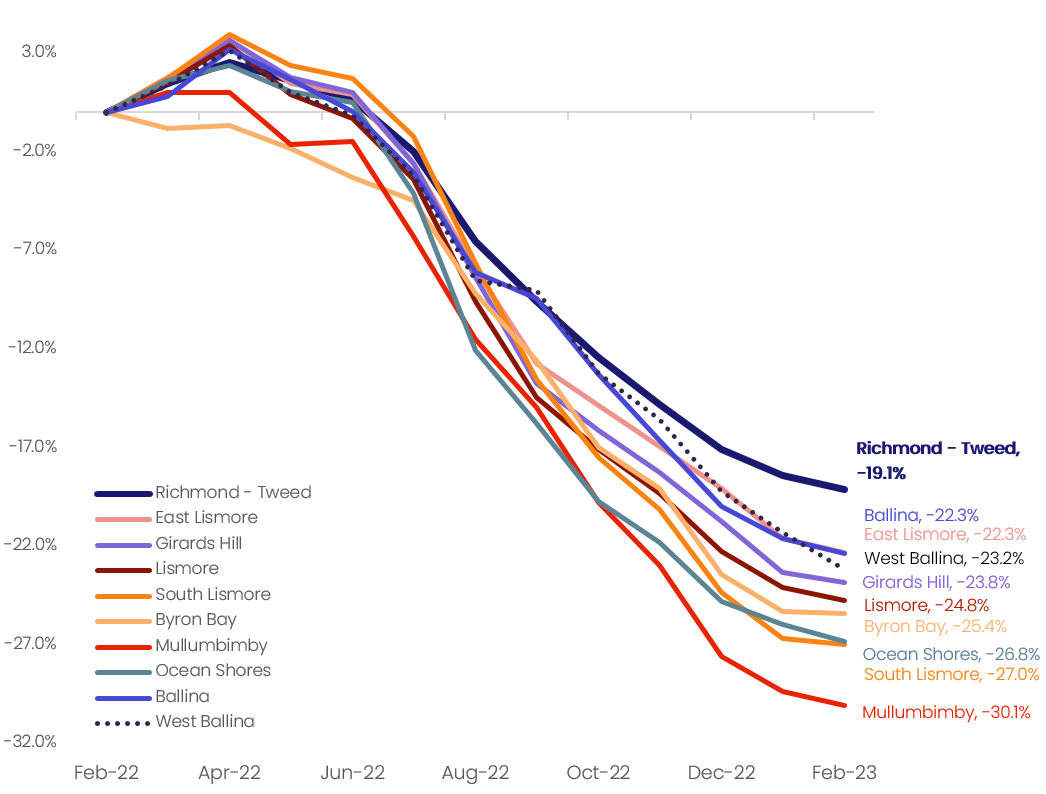
*note value changes across North Lismore were not available due to low sales activity.
While the current tightening cycle has amplified the downturn in values, the declines seen across flood-impacted suburbs are significantly steeper compared to the broader region and are among the largest suburb declines nationally. Outside of one flood-impacted suburb in Brisbane, all other suburbs recording similar value declines were more expensive Sydney suburbs, which are generally more sensitive to changes in interest rates.
Mullumbimby recorded the largest 12-month decline nationally, down -30.1%, roughly equivalent to a $432,000 decline in the median value, followed by South Lismore (-27.0%), Ocean Shores (-26.8%) and Byron Bay (-25.4%). The other impacted suburbs saw values fall between -22% and -25%.
Interestingly, a number of suburbs that were relatively unimpacted by flooding also recorded significant declines. Values across Bangalow, Lismore Heights and Suffolk Park fell by -28.4%, - 25.7%, and -24.3%, respectively, and East Ballina and Alstonville recorded slightly smaller declines of -20.2% and -19.6%. The reduced economic activity across the broader region has likely added downward pressure on these suburbs' value.
Lismore's elevated suburbs of Goonellabah recorded a milder -7.2% drop in values, and a number of surrounding farming communities saw gentler declines.
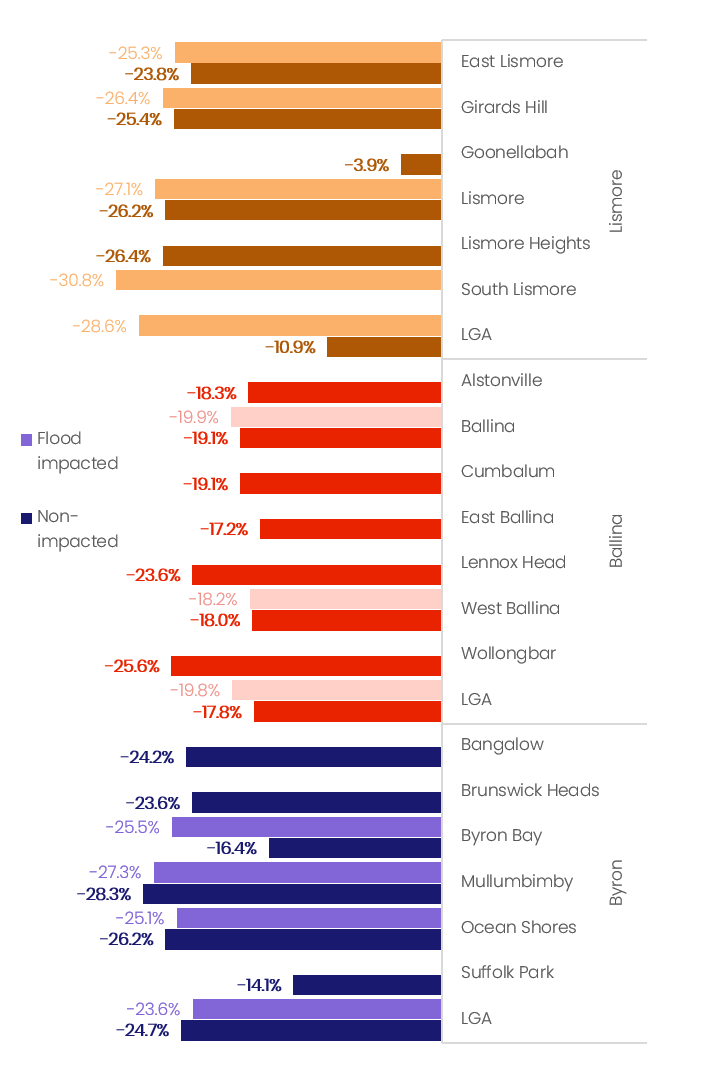
Using the same satellite imagery, CoreLogic has tracked the change in the median residential property valuation for flood-impacted properties compared with the change in non-impacted properties between February 2022 and February 2023. While this method isn't as reliable as CoreLogic's HVI at measuring value changes across the whole market, it does suggest a small performance gap between the two groups.
Lismore recorded the largest performance gap, with flood impacted properties recording a -28.6% drop in median values, compared to -10.9% for non-impacted properties, while Ballina recorded a milder performance gap of two percentage points. Byron Bay recorded a larger decline in the median value for non-impacted properties, down -24.7% compared to a -23.6% decline for flooded properties.
At the suburb level, impacted properties across Byron Bay recorded a 9.1 percentage point sharper decline compared to non-impacted properties, while the gap across East Lismore, Girards Hills, Lismore, Ballina and West Ballina ranged from 20 to 150 basis points. By contrast, Ocean Shores and Mullumbimby had slightly larger declines in unimpacted properties.
Figure 3 – Percentage change in the median valuation of flood-impacted properties compared to unimpacted properties- February 2022 to February 2023 – Northern rivers
Across Brisbane
The impact of the 2022 East Coast floods on Brisbane housing values has been more varied. Brisbane's relative affordability compared to the larger capitals, coupled with strong interstate migration and low advertised supply, saw dwelling values rise 38.1% between March 2020 and February 2022. The rate of value growth and sales activity had started to ease from the highs recorded in December 2021. However, the Brisbane property market was exhibiting some resilience amid worsening affordability and falling consumer sentiment, relative to less affordable markets like Sydney and Melbourne.
The extreme weather event saw the equivalent of the city's average annual rainfall falling over three days. Despite recording a smaller peak flood level compared to 2011, the concentration of rainfall across the inner city, as opposed to the river catchment to the west, saw more properties impacted. Across the Brisbane council area, approximately 3.5% of residential housing stock was impacted by flooding, the majority of these located across the Inner city along with the South and West SA4's.
Figure 4 maps the portions of properties impacted by flooding by suburb. Rocklea saw approximately 49.3% of properties impacted, while Tennyson, Chelmer, Fairfield and Graceville saw 37.3%, 30.3%, 23.6% and 21.0% impacted, respectively. The inner-city suburbs of Newstead (33.2%), Ascot (28.0%), Milton (22.7%), and West End (21.3%) and St Lucia (22.9%) in the west all saw a significant portion of properties impacted, the majority of which were units. By contrast, the majority of impacted properties across Westlake (17.8%) and Fig Tree Pocket (14.6%) in the west, and Yeronga (13.0%) in the south were houses.
Figure 4 – Portion of housing stock impacted by floods – Brisbane suburbs.
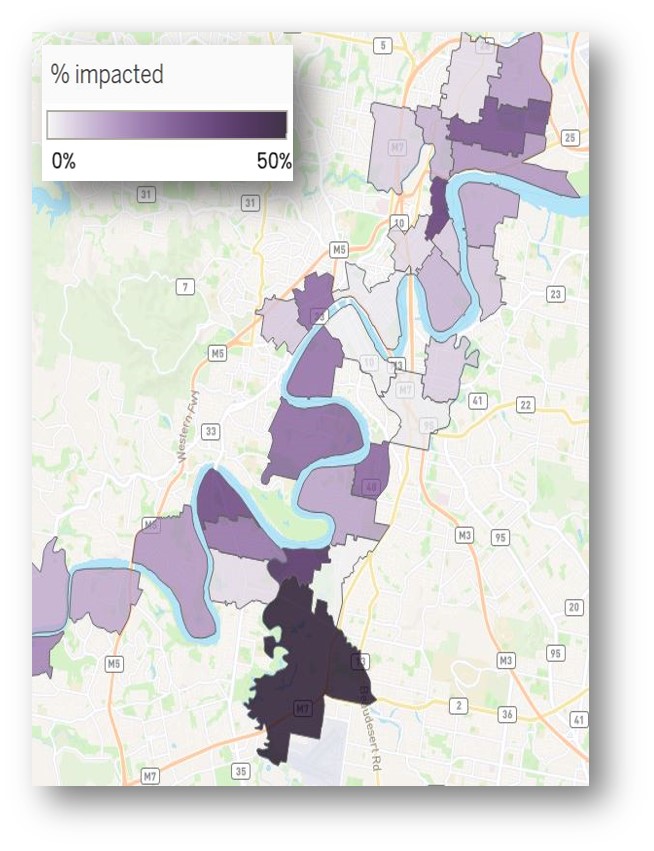
Figure 5 shows the cumulative change in CoreLogic's Home Value Index across the Brisbane local government area and a selection of impacted suburbs. Across the Brisbane council area, dwelling values continued to rise through May before falling -9.3% below the levels recorded during the floods and -12.4% below their peak value. Interestingly, Fairfield was the only impacted suburb to record a fairly quick and steep decline in value, falling -24.3% over the 12 months to February 2023. The other impacted suburbs continued to rise in value through to May and June before shifting downwards with the broader trend.
Figure 5 – Change in dwelling values from February 22 – Brisbane council and selected flood-impacted suburbs.
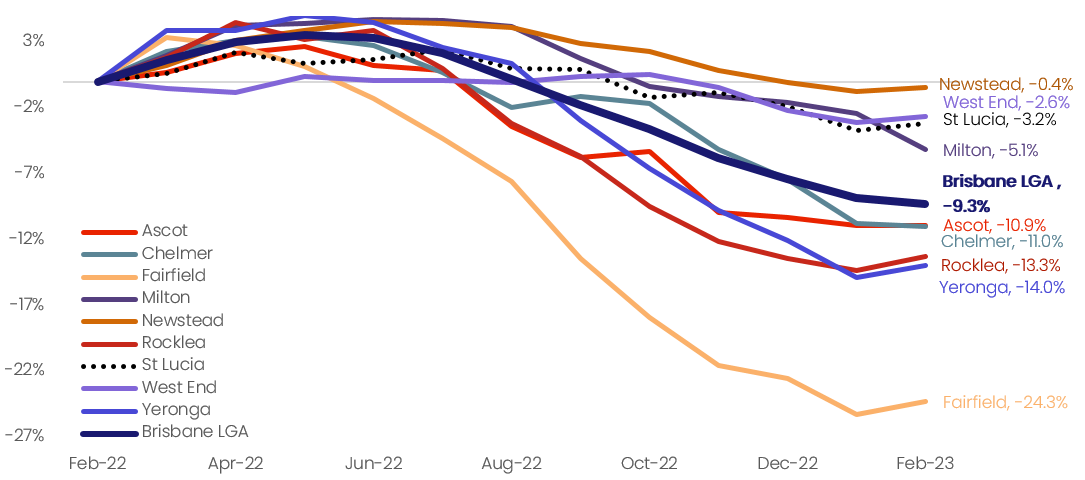
*note value changes across Tennyson were not available due to low sales activity.
The variance in the depth of value falls across the remaining impacted suburbs can broadly be explained by the make up of housing stock. Dwelling value declines across Newstead (-0.7%), Milton (-2.4%), West End (-3.1%) and St Lucia (-3.7%) have been fairly mild despite the floods, likely due to the higher proportion of units across these suburbs, which have remained fairly resilient to a material drop in values compared to houses though the downturn to date. Additionally, the majority of damage sustained by flood-impacted units was likely limited to communal property (car parks, lift wells and foyer entries for example), resulting in a smaller direct impact to homeowners.
Figure 6 – Percentage change in the median valuation of flood-impacted properties compared to unimpacted properties – February 2022 to February 2023– Brisbane
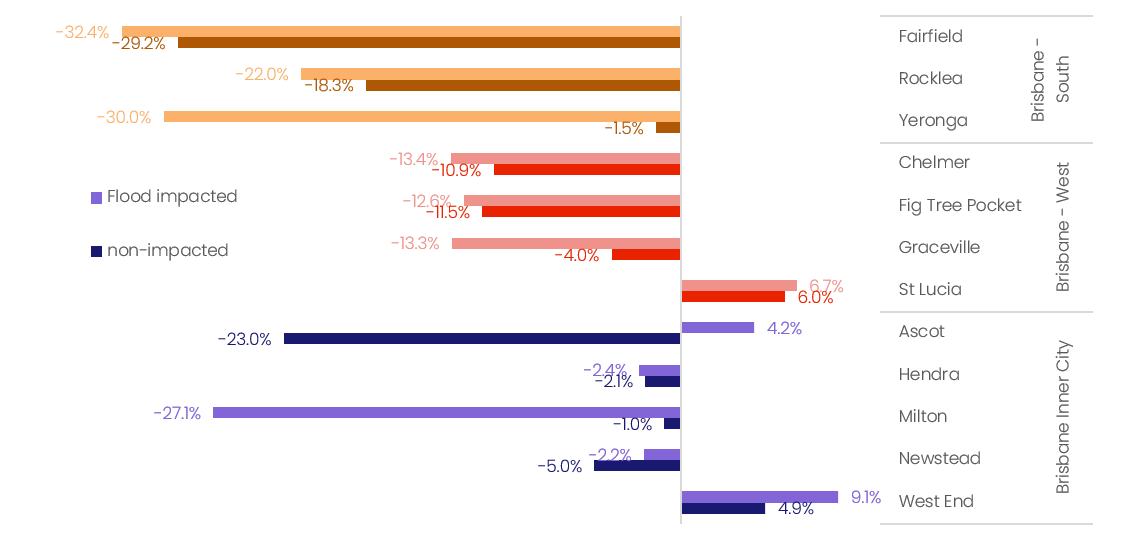
Comparing the change in the median valuation for flood-impacted properties to the change in non-impacted properties, Milton, Yeronga, and Graceville recorded notably larger declines across flooded properties with a performance gap of-26.1, -28.5, and -9.2 percentage points, respectively. Fairfield, Rocklea and Chelmer recorded performance gaps between -2 and -4 percentage points. Newstead and Ascot both recorded larger declines across unimpacted properties, while West End and St Lucia recorded stronger increases across impacted properties compared to non-impacted properties. One possible explanation for the larger increases recorded across flood-impacted units in St Lucia and West End is their river views, as well as the amenities and lifestyle benefits that inner city riverfront living offers.
Moving forward
Looking forward, the outlook for flood-impacted suburbs across the Northern Rivers and Brisbane remains uncertain. Historically, both markets have been fairly resilient to flood-induced declines. Following the 2011 floods, the majority of Brisbane's flood-impacted suburbs saw values recover within three to five years, with most riverside precincts recouping their waterfront premium. Directly after the 2017 floods, property values across Lismore remained somewhat flat before returning to the national trend within six months.
However, given the severity of this event, and the short timeframe between major flood events, it's likely the current value declines across the Northern rivers and impacted house suburbs in Brisbane could be more enduring.
Attitudes towards flood-prone areas, and climate risk in general, are changing. Homeowners, lenders and insurers are becoming more cautious of the risks associated with climate change and are adjusting their risk premiums accordingly. For some impacted homeowners, the risk of another flood is likely to be top of mind, and we could see a number of residents accept government buy-back offers where they are available. For others, the increased costs of insurance could price out existing owners and dissuade new buyers from areas vulnerable to flooding.
Additionally, the full impact of flooding on property values probably won’t be known for some time. While the ICA has closed approximately 80% of insurance claims, a sizable number of people are still waiting for building repairs to start, while other uninsured residents have been left with limited resources to undertake repairs. Government intentions around buy backs are still playing out and the number of post flood home sales is still low. The full impact of the floods won’t be known until these factors have played out.
In the year since the 2022 East Coast flood, several other major weather events have impacted Australian properties, and just this month, Cyclone Gabrielle caused widespread devastation across New Zealand's North Island. With these types of events becoming more frequent and more severe, it's clear that the real estate, finance and insurance sectors will need to be cognisant of the risks associated with climate change and ensure their policies and risk assessments are evolving with the changing environmental factors.
While weather events are likely to have a negative impact on housing values, other factors can act to offset the risk to values such as low inventory, policy settings, migration and emotional factors. Despite the risk factors, it seems Australians still want to live close to the water.
Download the East Coast Floods analysis

Meet Kaytlin Ezzy
Economist
Kaytlin Ezzy is an Economist at CoreLogic, Australia’s leading property data, information, analytics and services provider.
Full profile