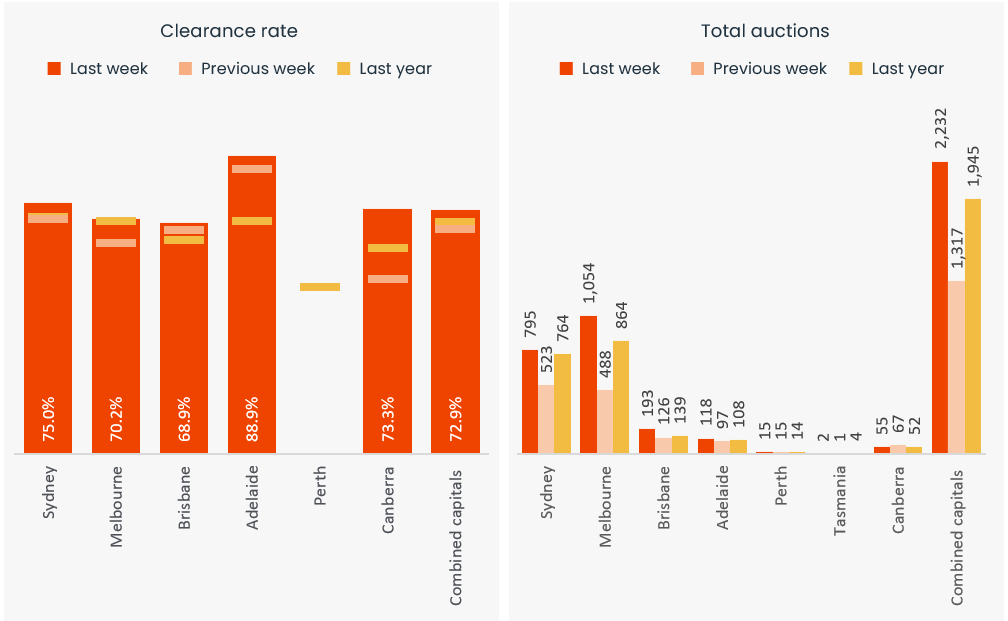
The number of homes going under the hammer rebounded last week following the previous week’s drop in auction volume due to the King’s Birthday long weekend in many states. 2,232 auctions were held, up from 1,317 the week prior and nearly 15% higher than at the same time last year.
The preliminary combined capitals clearance rate also bounced higher to 72.9%, the strongest early result since the first week of May (73.5%). The previous weeks preliminary clearance rate, which came in at 67.3% and revised down to 62.0% once finalised, was the lowest since late last year.
Capital City Auction Statistics (Preliminary)
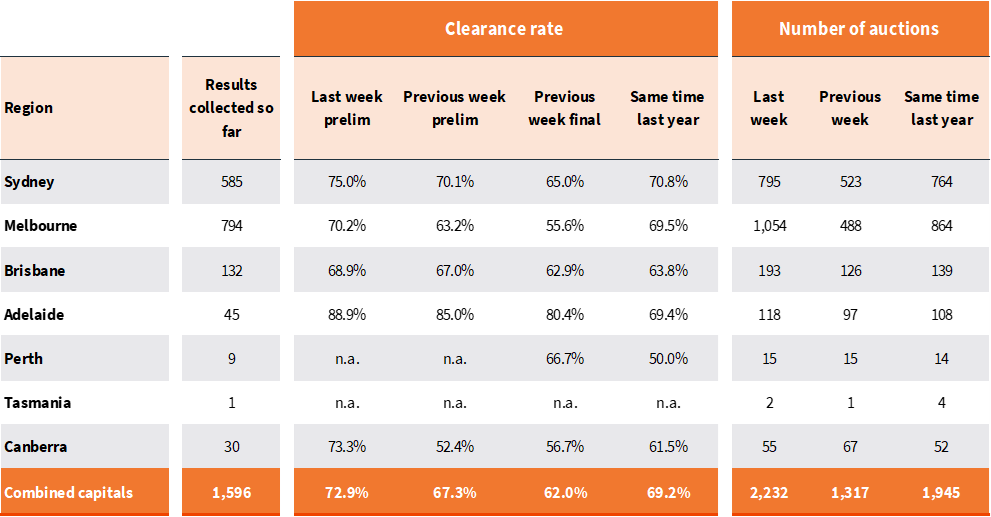
With 1,054 homes going under the hammer across Melbourne, the number of auctions held more than doubled relative to the previous week (488) and the preliminary clearance rate rose to 70.2%, the highest early result since the last week of May.
The volume of auctions rose to 795 in Sydney, up from 523 the week prior and 764 held at the same time last year. The preliminary clearance rate (75.0%) also showed some strength, rising to the highest level since the week ending May 12 (75.9%).
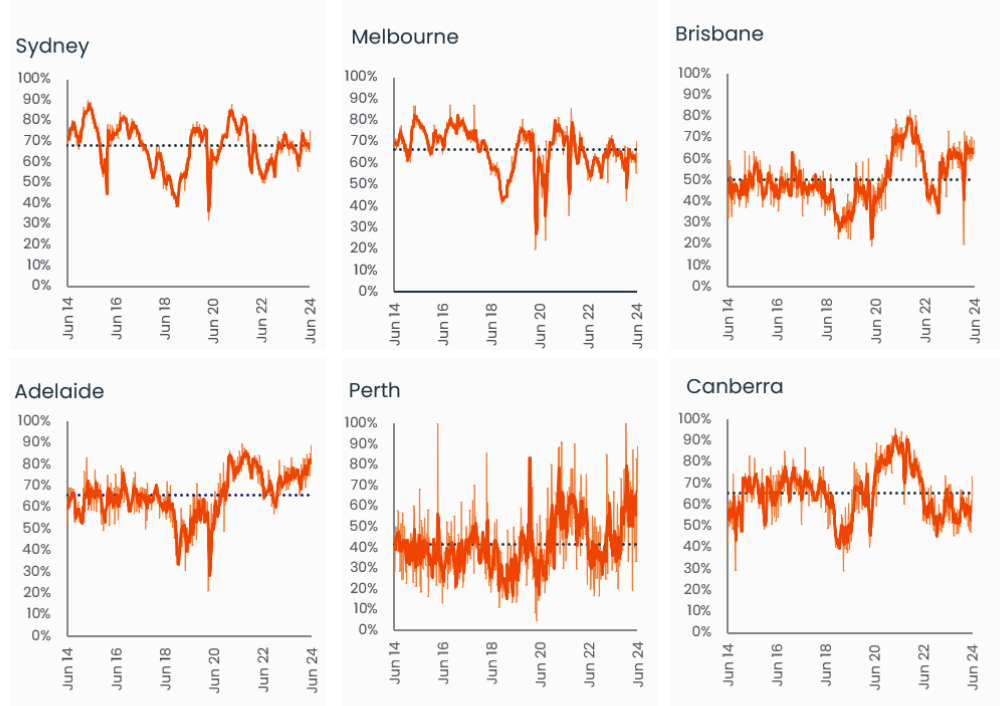
Capital City Auction Statistics over time
Historical clearance rates utilise the final auction clearance rate, while the current week is based on the preliminary clearance rate.
Brisbane led the volume across the smaller auction markets with 193 homes taken to auction, returning a preliminary clearance rate of 68.9%, followed by Adelaide with 118 auctions held and a preliminary clearance rate of 88.9%. 55 auctions were held across the ACT with an early success rate of 73.3%.
Despite the higher number of homes taken to market, clearance rates are looking resilient, suggesting demand is keeping up with the rise in vendor activity. The trend in auction markets lines up with the broader trend in new listings, where vendor activity was 9.5% above the previous five-year average, while overall stock levels were tracking 16.1% below the five-year benchmark, demonstrating a healthy rate of absorption.
At the same time, dwelling values continue to trend higher, with CoreLogic’s daily HVI rising a further 0.8% over the past four weeks across the combine capitals.
Capital City Auction Statistics (Preliminary)
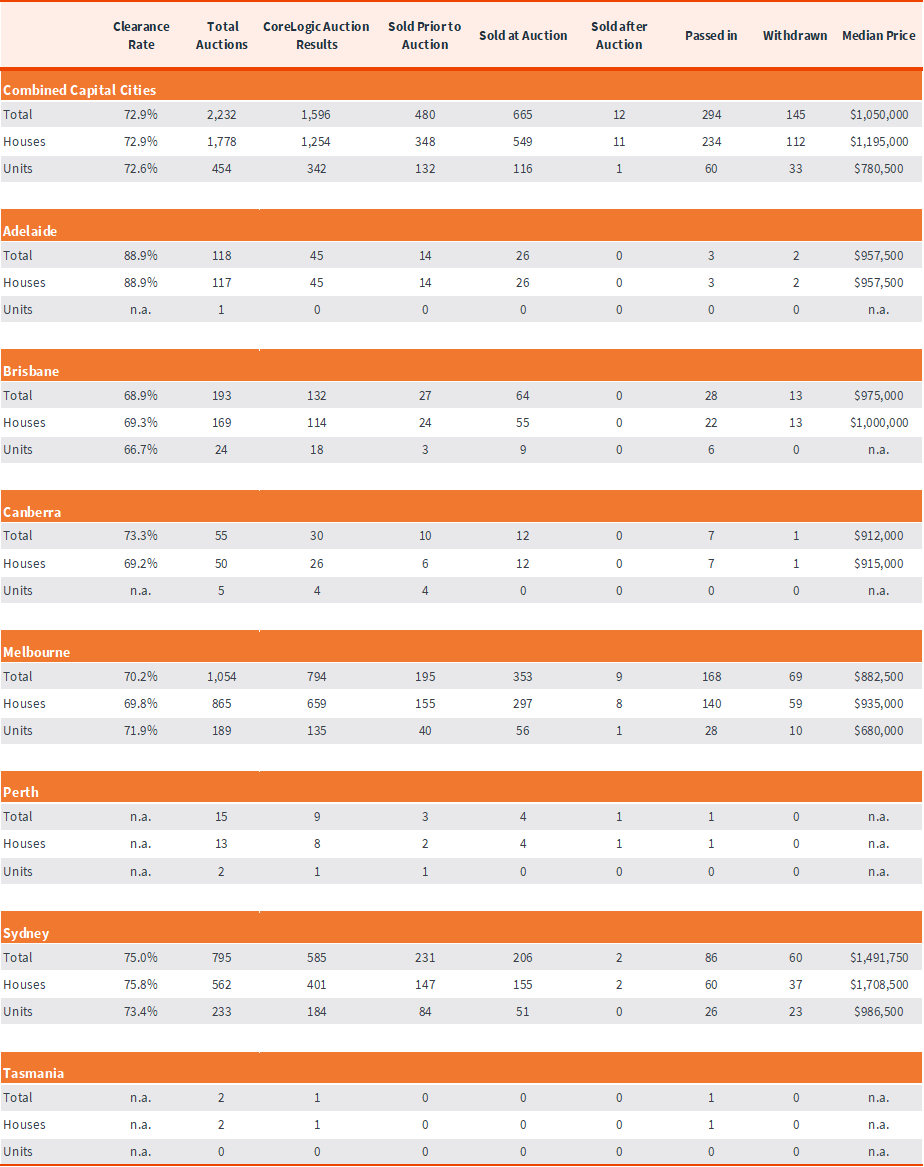
The above results are preliminary, with ‘final’ auction clearance rates published each Thursday. CoreLogic, on average, collects 99% of auction results each week. Clearance rates are calculated across properties that have been taken to auction over the past week.
Sub-region auction statistics (preliminary)
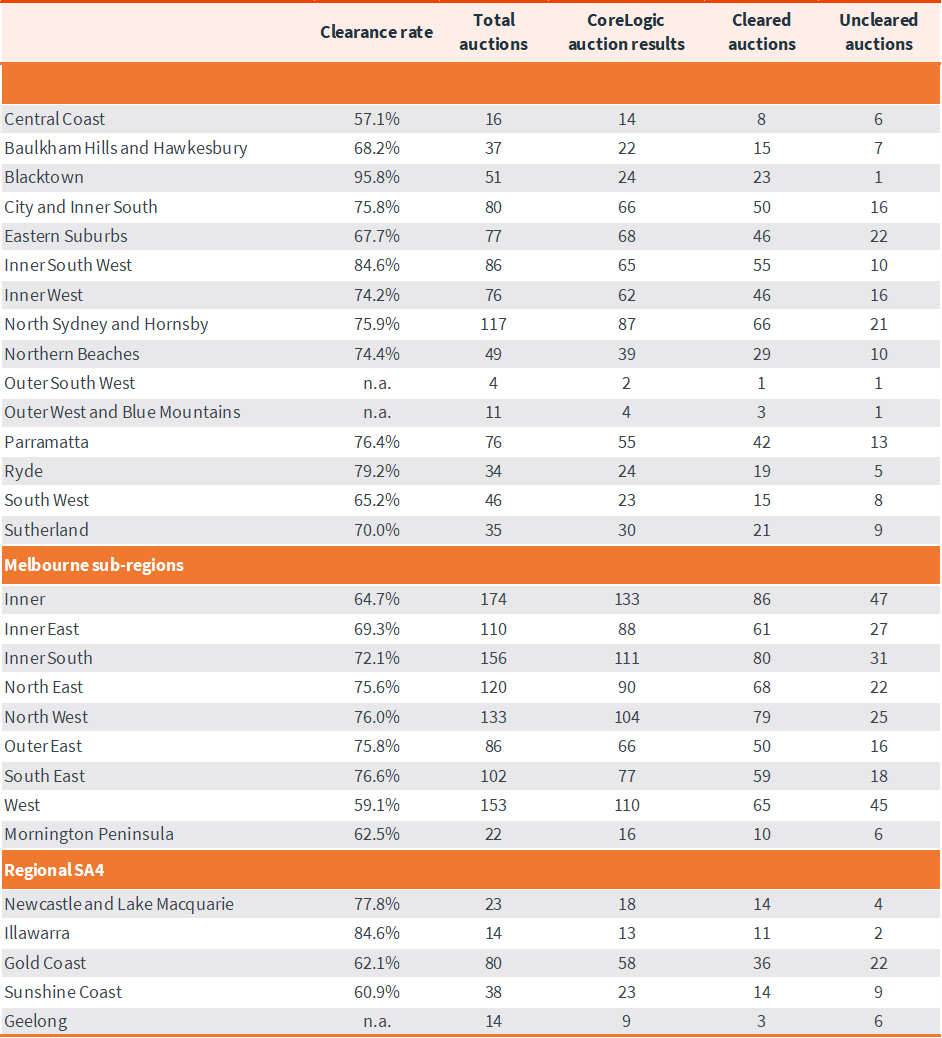
CoreLogic, on average, collects 99% of auction results each week. Clearance rates are calculated across properties that have been taken to auction over the past week.
Download Property Market Indicator Summary
