The preliminary auction clearance rate stepped a little higher last week, rising to 73.5% across the combined capitals, up from a preliminary rate of 72.9% the week prior which revised lower to 66.1% once finalised.
Sydney continued to standout with a strong preliminary clearance rate, at 78.1%, although this was slightly lower than the previous week at 78.3% (71.0% on finalised numbers).
Capital City Auction Statistics (Preliminary) – headline results
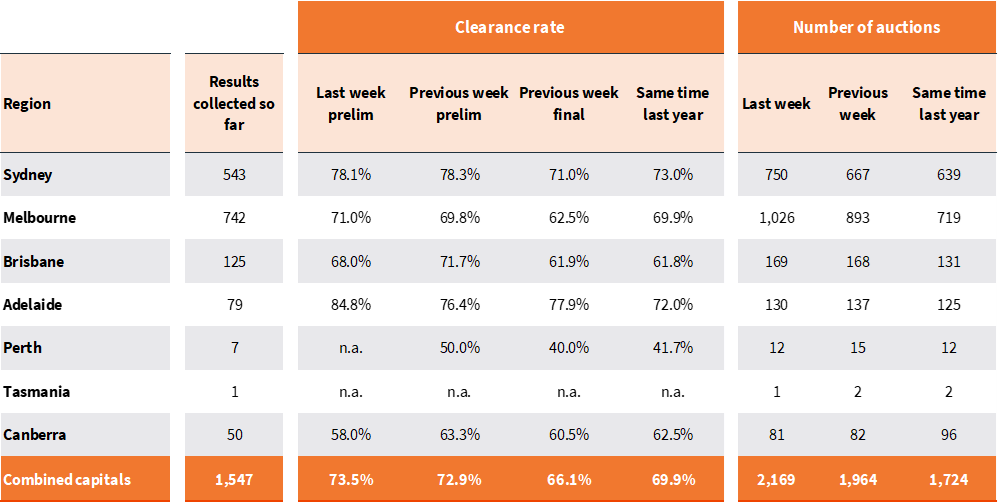
Melbourne’s early clearance rate rose above the 70% mark to 71.0%, slightly higher than the previous week’s 69.8% result (62.5% on finalised numbers). The result was on the back of a large volume, with 1,026 auctions held, the first 1,000+ week of auctions since the week prior to Easter.
Capital City Auction Statistics over time
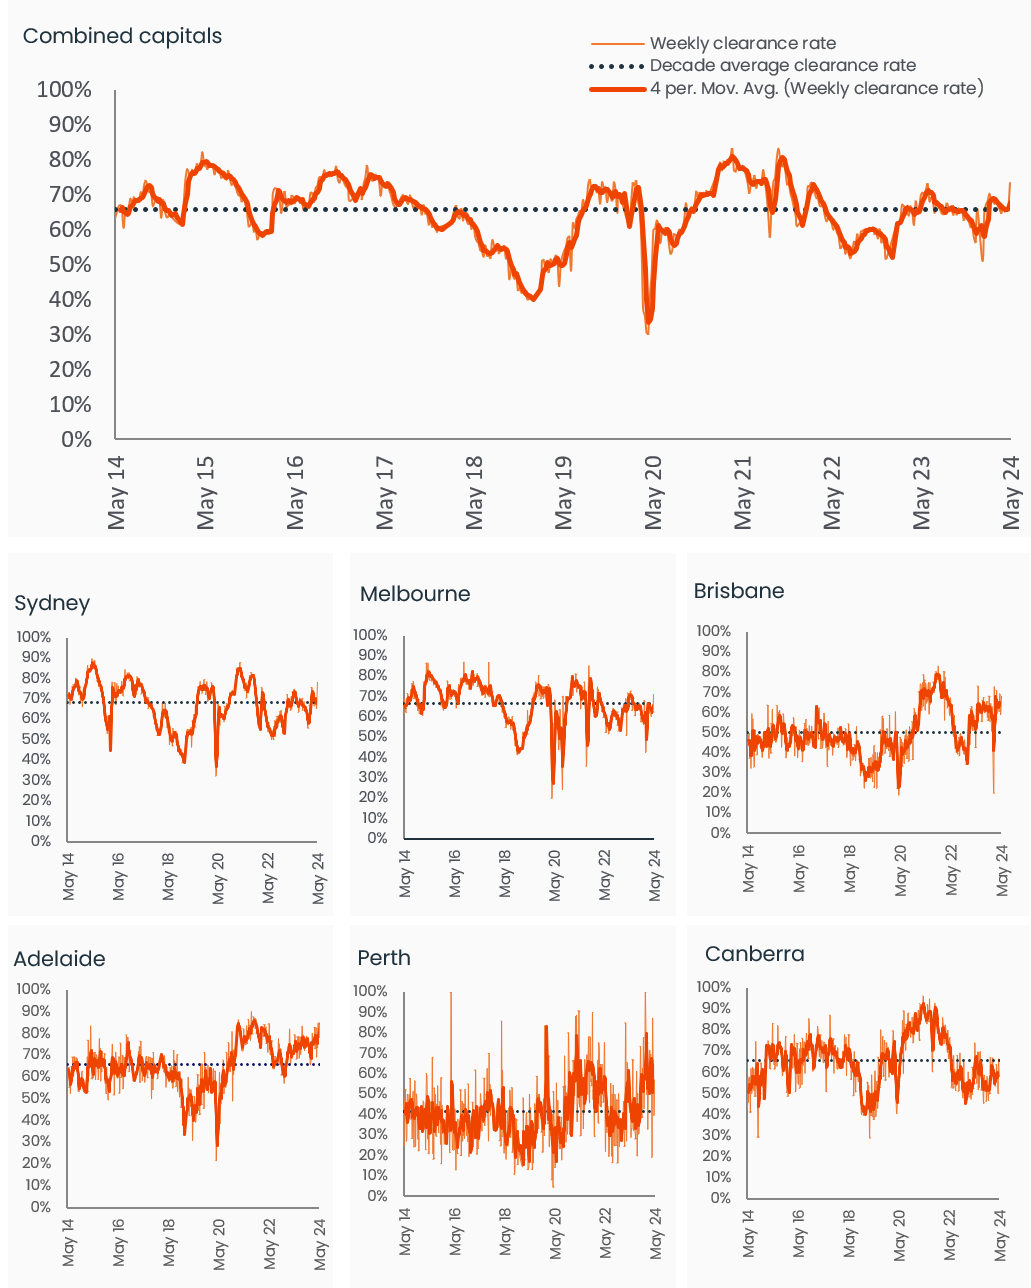
Historical clearance rates utilise the final auction clearance rate, while the current week is based on the preliminary clearance rate.
Across the smaller capitals, Brisbane recorded the largest volume of auctions (169) but the preliminary clearance rate slipped from 71.7% a week earlier to 68.0% (lowest since Easter). Adelaide continued to record a high early clearance rate at 84.8% across 130 auctions, while auction results across the ACT were soft, returning a preliminary clearance rate of 58.0% (lowest since the last week of Feb).
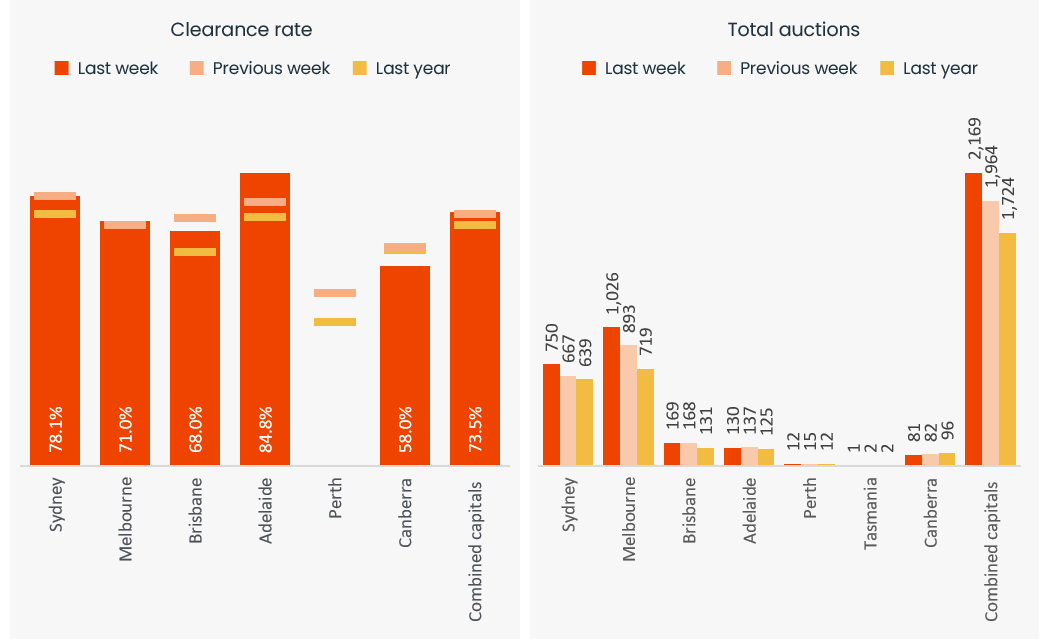
Capital City Auction Statistics (Preliminary)
The above results are preliminary, with ‘final’ auction clearance rates published each Thursday. CoreLogic, on average, collects 99% of auction results each week. Clearance rates are calculated across properties that have been taken to auction over the past week.
With 2,169 auctions held last week, the volume of properties taken to market is holding well above levels a year ago (+25.8% or 445 higher relative to the same time last year). More broadly, the rolling four week count of new listings added to the market was nearly 23% higher than at the same time a year ago and 12.1% above the previous five-year average.
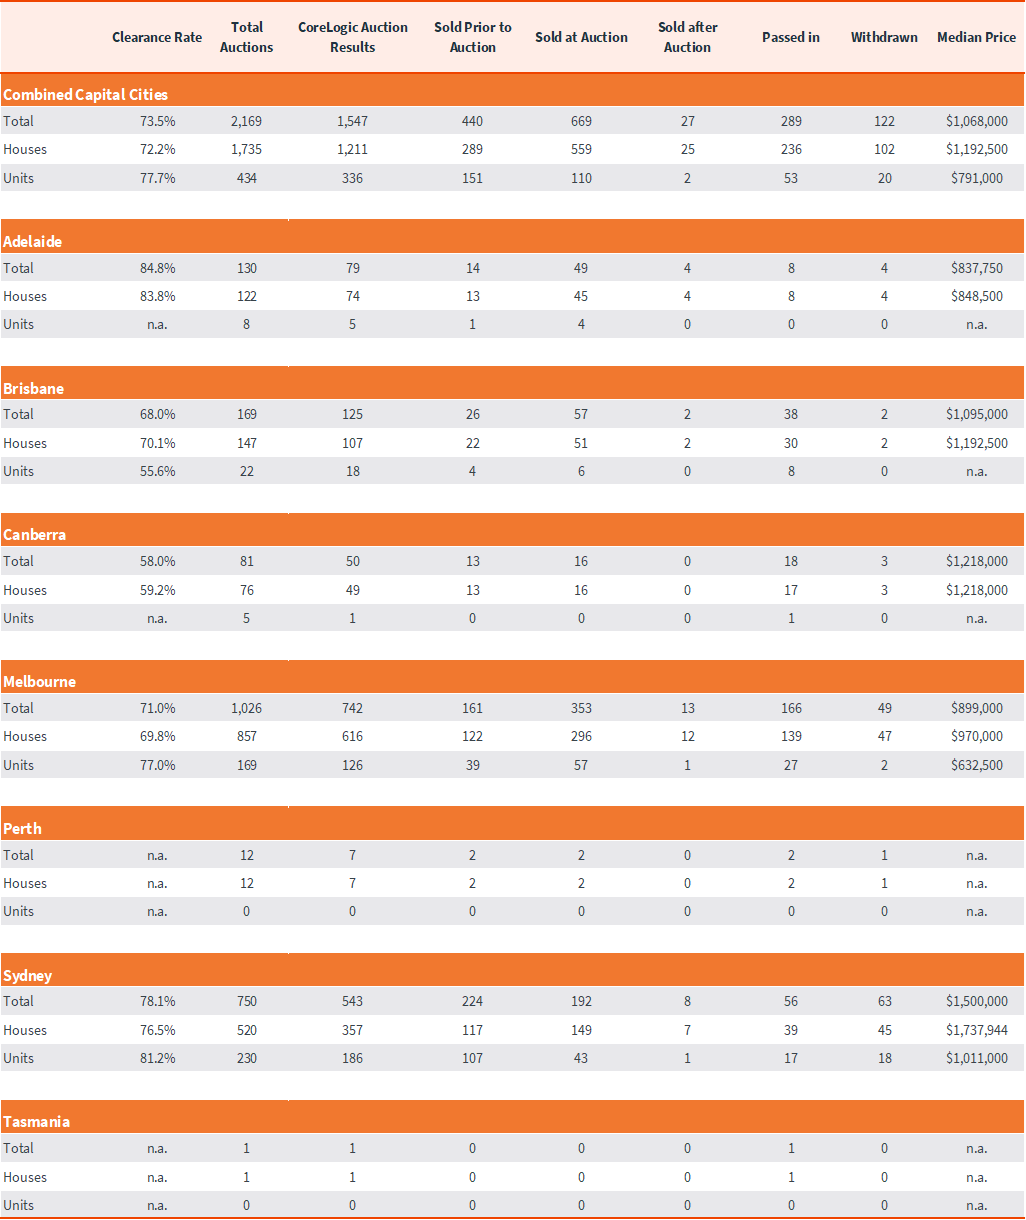
Sub-region auction statistics (preliminary)
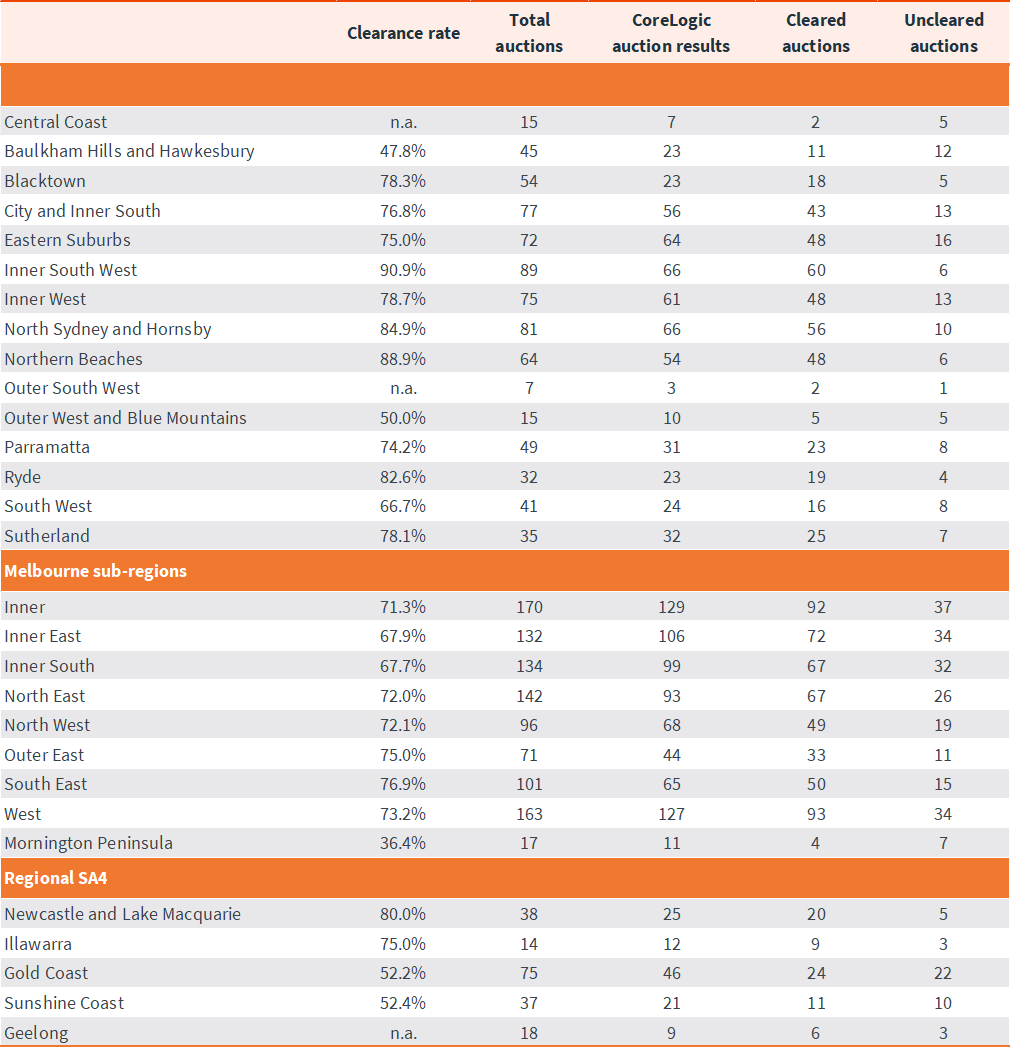
CoreLogic, on average, collects 99% of auction results each week. Clearance rates are calculated across properties that have been taken to auction over the past week.
The volume of auctions is set to rise this week. CoreLogic are currently tracking more than 2,200 properties scheduled to go under the hammer.
Download Property Market Indicator Summary

Meet Caitlin Fono
Sr Associate, Research Support
Caitlin has spent more than a decade working with property data and analytics in various roles, earning a position on the CoreLogic research team in 2013. As a respected and highly experienced research analyst, Caitlin works with high frequency data sets, regularly updating our widely read auction reporting, weekly activity updates and customised data briefs.
Full profile