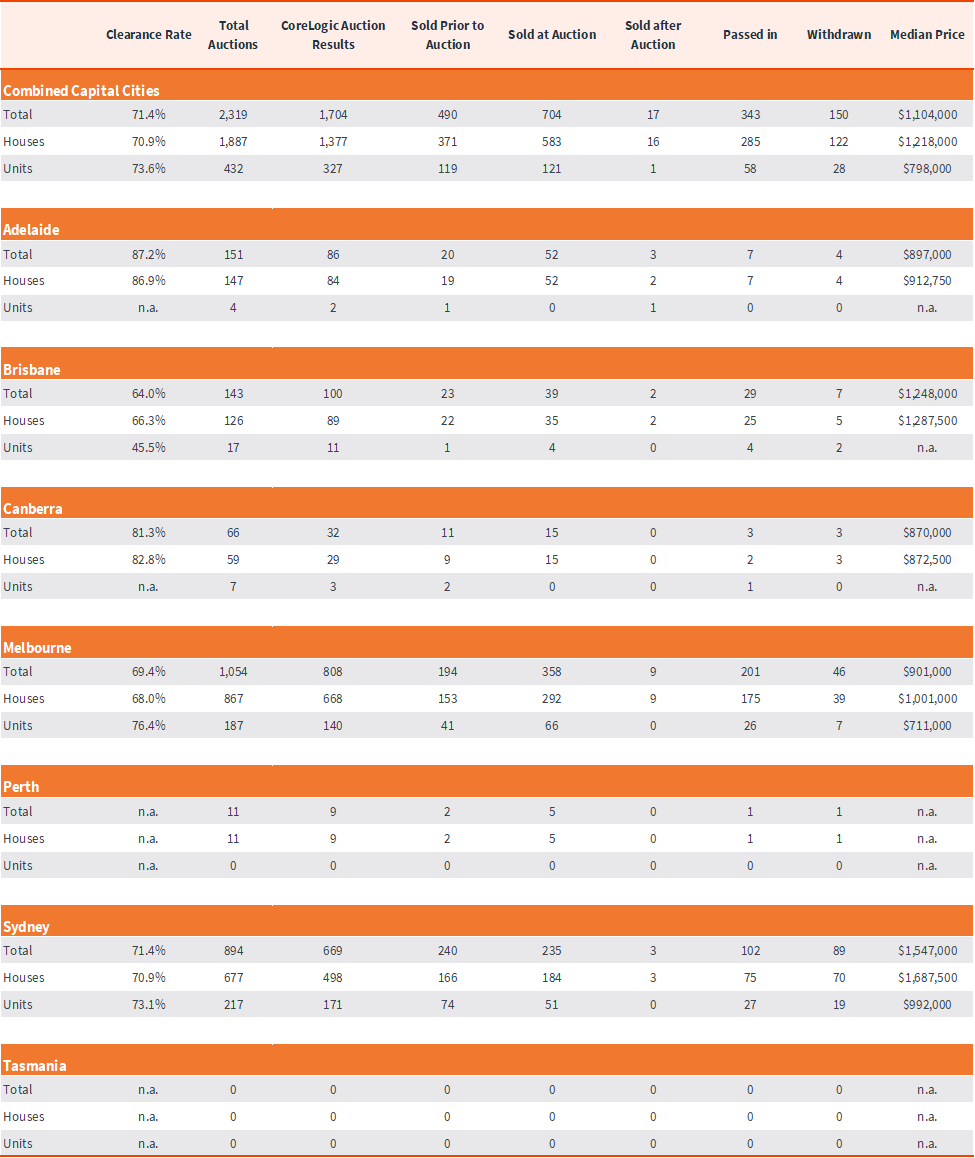
The preliminary clearance rate nudged 10 basis points lower last week, to 71.4% (71.5% the previous week which revised down to 63.6% once finalised, the lowest final clearance rate so far in 2024).
The volume of auctions has been trending higher, rising to an 11-week high, with 2,319 homes taken under the hammer, the highest number of auctions since the week before Easter and 28% above levels recorded at the same time last year.
Across the major auction markets, Sydney recorded a 71.4% preliminary clearance rate, down from 72.7% over the previous week (which revised lower to 67.3% on final results). This was Sydney’s lowest preliminary clearance rate so far this year. Melbourne’s preliminary clearance rate also came in lower relative to the week prior, at 69.4% (down from 71.2% which revised to 61.0%).
Capital City Auction Statistics (Preliminary)
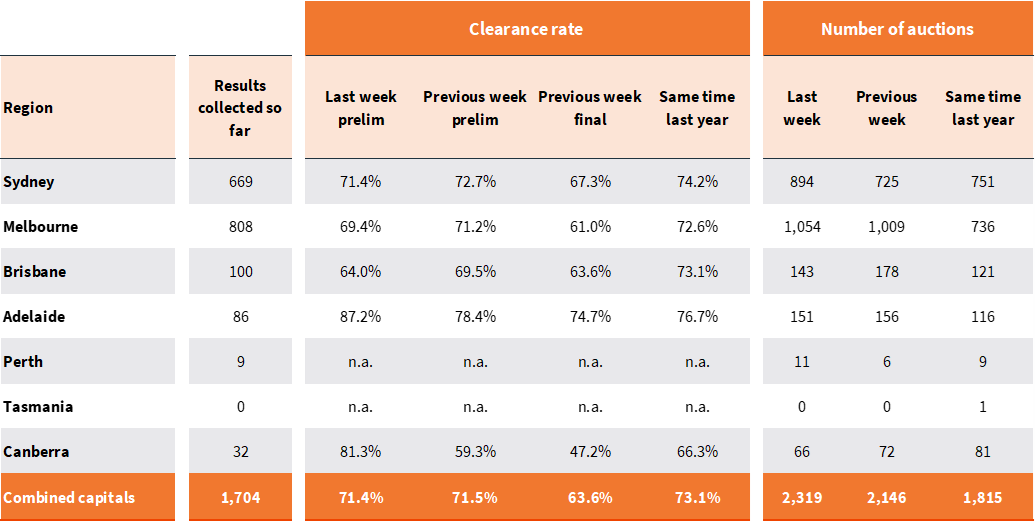
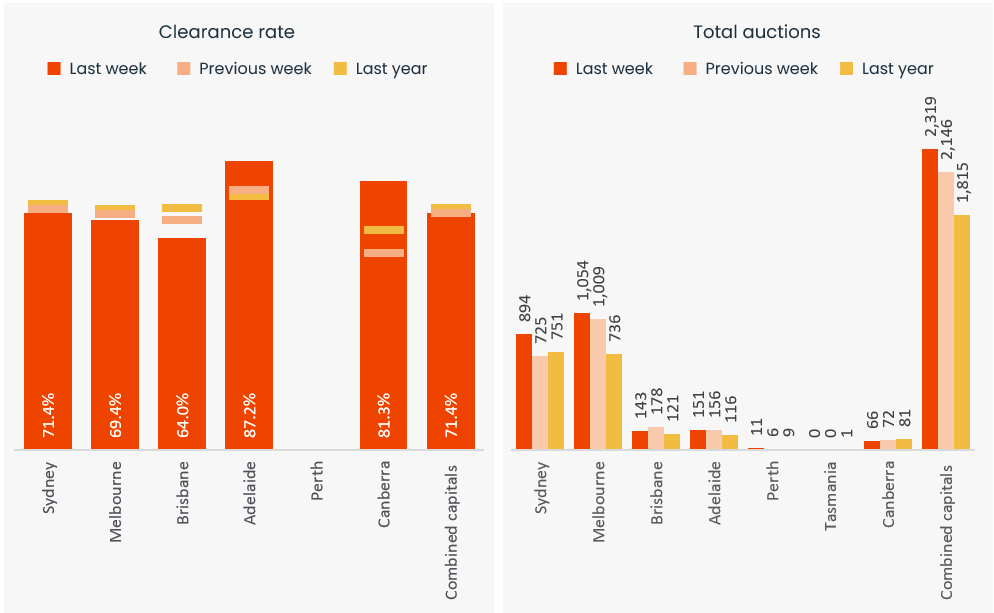
Across the smaller auction markets, Adelaide recorded a preliminary clearance rate of 87.2%, up 8.8 percentage points from 78.4% over the previous week (revising down to 74.7% on final results which is the lowest final clearance rate since the first week of April). Brisbane recorded a clearance rate of 64.0%, the lowest preliminary clearance rate so far this year, while the ACT came in at 81.3%, up substantially from the previous week (59.3%, revising down to 47.2%, the lowest final clearance rate so far this year).
The volume of auctions has been tracking well above levels a year ago, but is set to drop sharply this week due to the Kings Birthday long weekend in some states, with around 1,300 auctions currently scheduled. Next week should bounce back with around 2,275 auctions currently in the calendar.
Capital City Auction Statistics over time
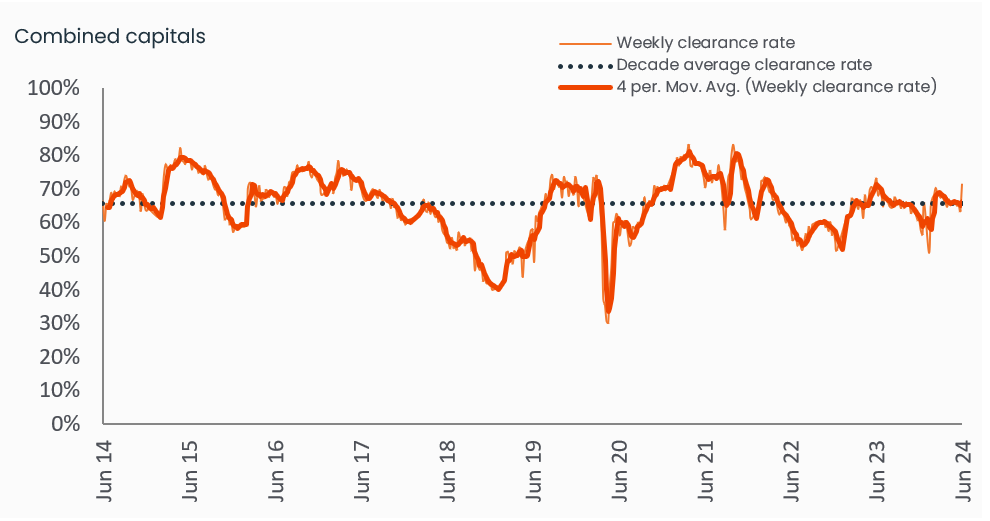
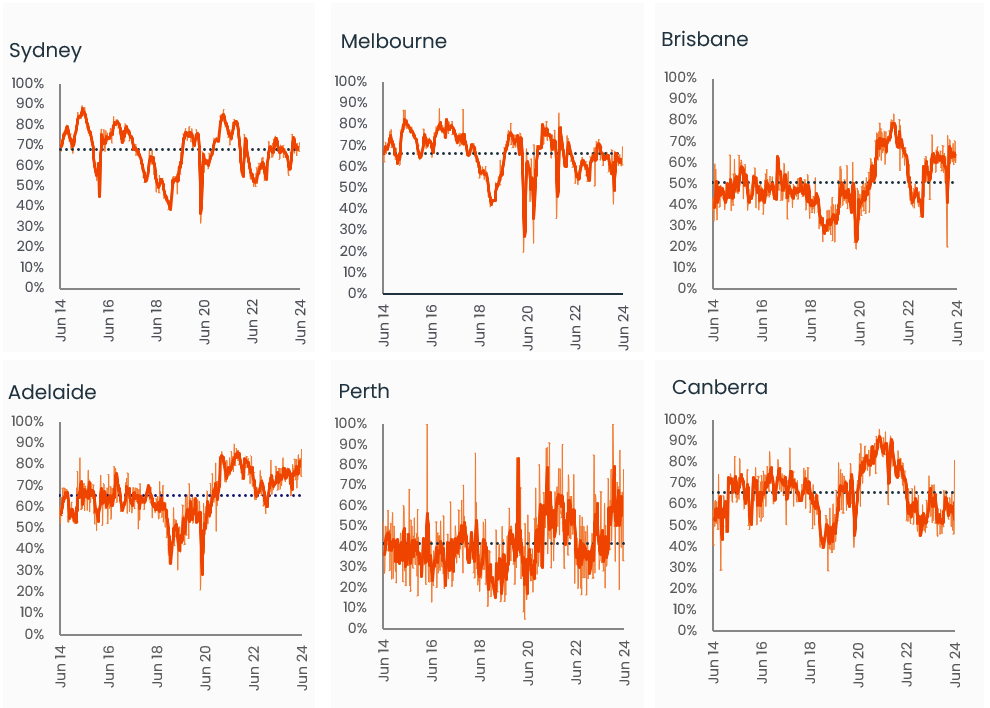
Historical clearance rates utilise the final auction clearance rate, while the current week is based on the preliminary clearance rate.
Capital City Auction Statistics (Preliminary)
The above results are preliminary, with ‘final’ auction clearance rates published each Thursday. CoreLogic, on average, collects 99% of auction results each week. Clearance rates are calculated across properties that have been taken to auction over the past week.
Sub-region auction statistics (preliminary)
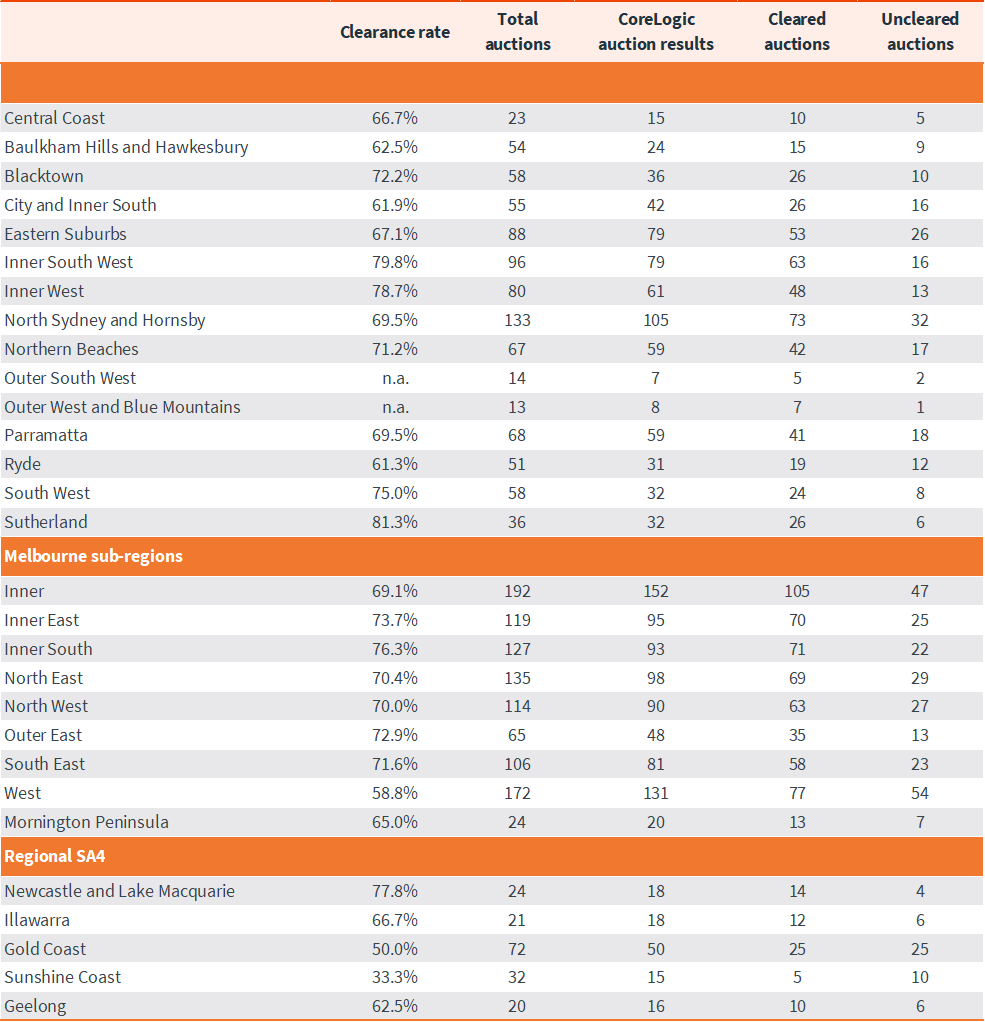
CoreLogic, on average, collects 99% of auction results each week. Clearance rates are calculated across properties that have been taken to auction over the past week.
Download Property Market Indicator Summary

Meet Caitlin Fono
Sr Associate, Research Support
Caitlin has spent more than a decade working with property data and analytics in various roles, earning a position on the CoreLogic research team in 2013. As a respected and highly experienced research analyst, Caitlin works with high frequency data sets, regularly updating our widely read auction reporting, weekly activity updates and customised data briefs.
Full profile