There were 1,551 homes taken to auction across the combined capitals last week, down from 1,712 over the previous week, although up from this time last year (1,482).
In terms of clearance rates, capital city auction markets continued to show a solid bounce back from the weak results in late 2023, with the preliminary clearance rate rising to 76.2%, the highest since the first week of June last year. The early clearance rate was a step higher relative to last week (73.9%), which revised down to 68.3% once finalised.
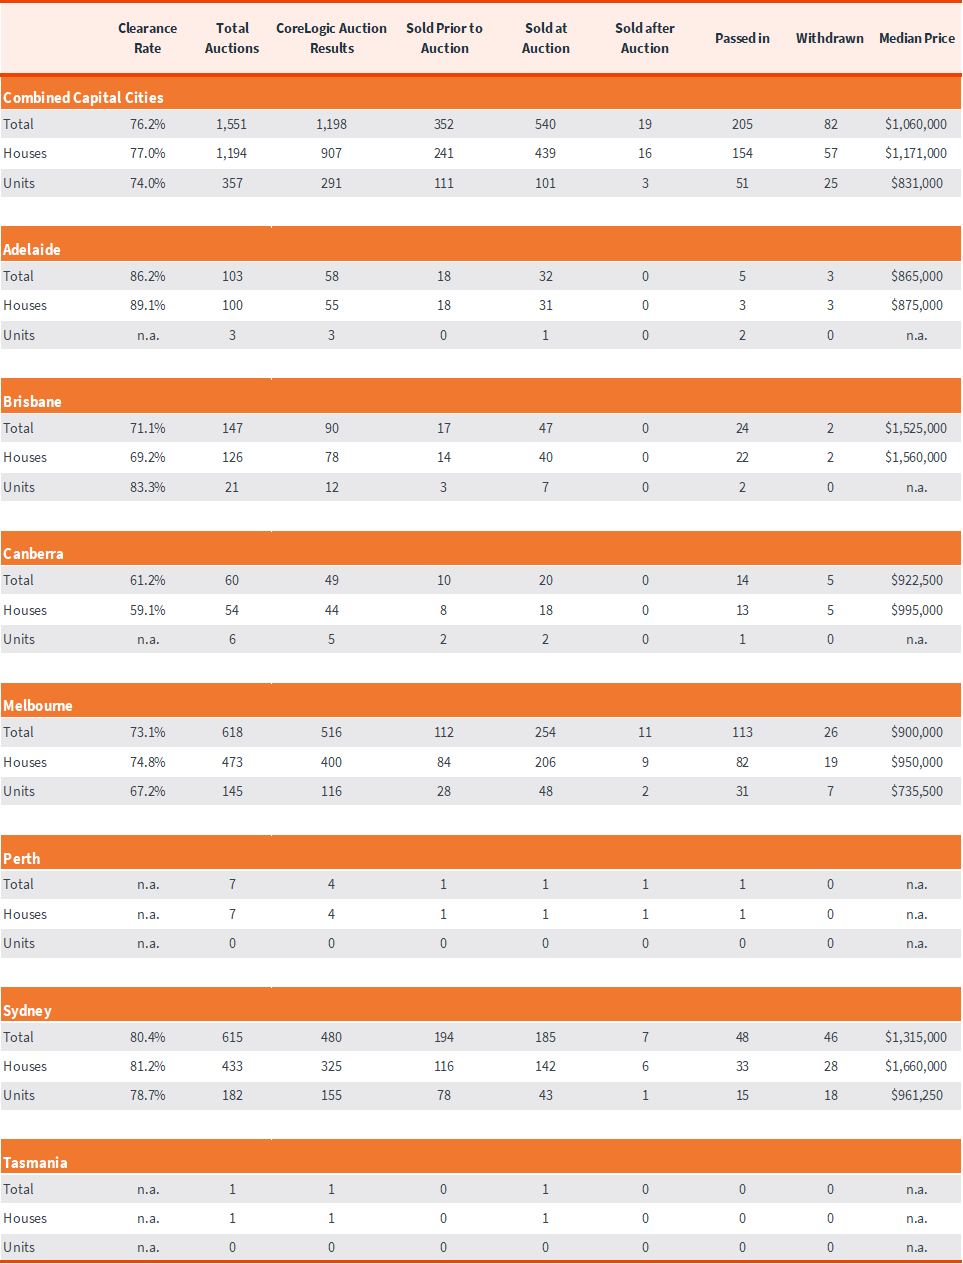
Capital City Auction Statistics (Preliminary)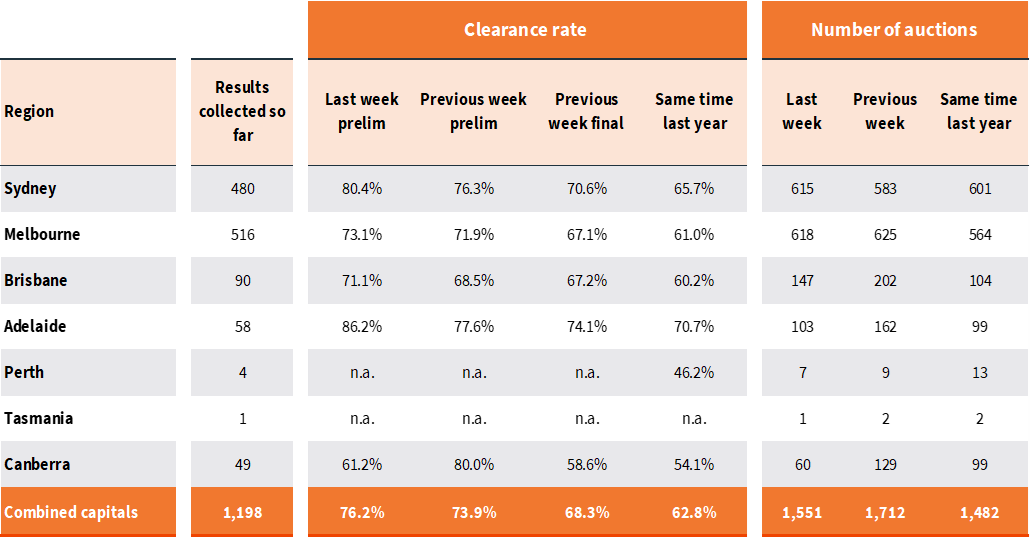
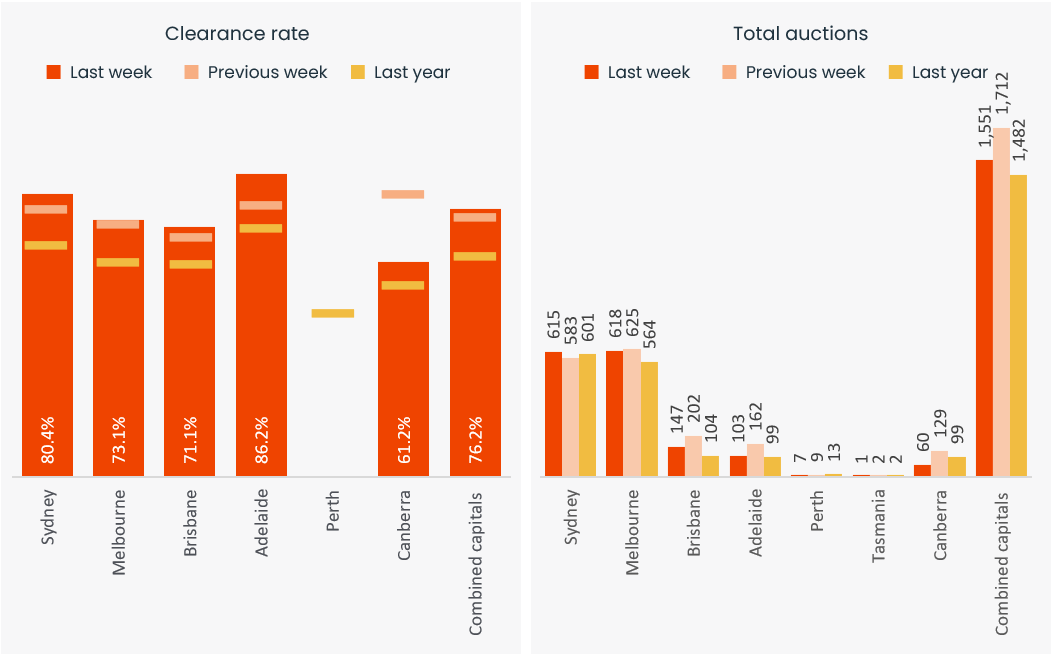
Melbourne was host to the largest number of auctions last week, with 618 homes taken to market, returning a preliminary clearance rate of 73.1% (highest since mid-July last year). Sydney wasn’t far behind with 615 auctions, returning an early clearance rate of 80.4%, the highest preliminary result since the week ending October 24, 2021. This time last year, both markets saw slightly fewer homes taken to auction, with 564 auctions held in Melbourne and 601 in Sydney.
Across the smaller capitals, Brisbane recorded the busiest auction week, with 147 homes taken to auction, followed by Adelaide (103), Canberra (60) and Perth (7). Adelaide recorded the highest preliminary clearance rate at 86.2%, followed by Brisbane and Canberra, with early success rates of 71.1% and 61.2% respectively. In Perth, three of the four auction results collected so far were positive, while the one auction held in Tasmania was successful.
Capital City Auction Statistics over time
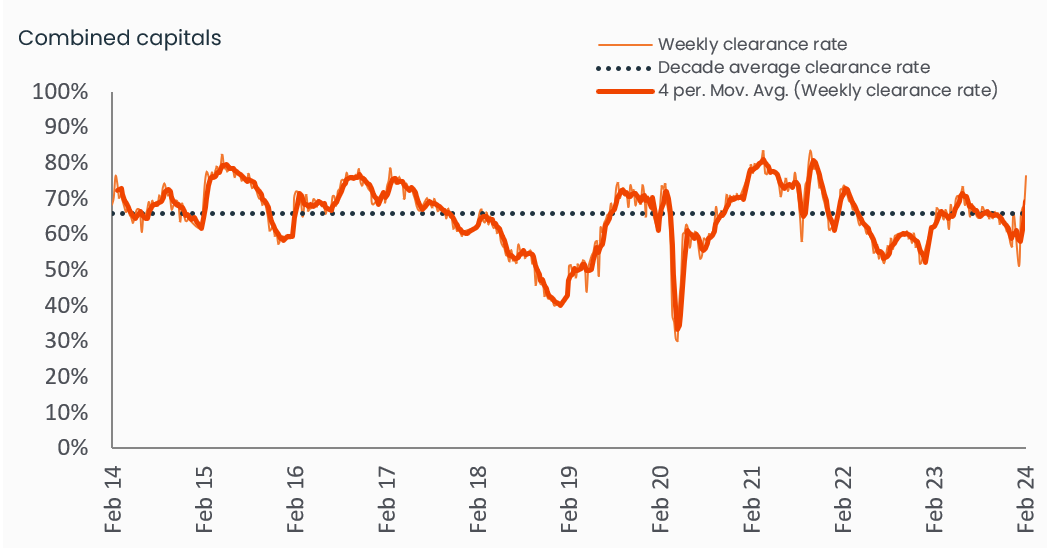
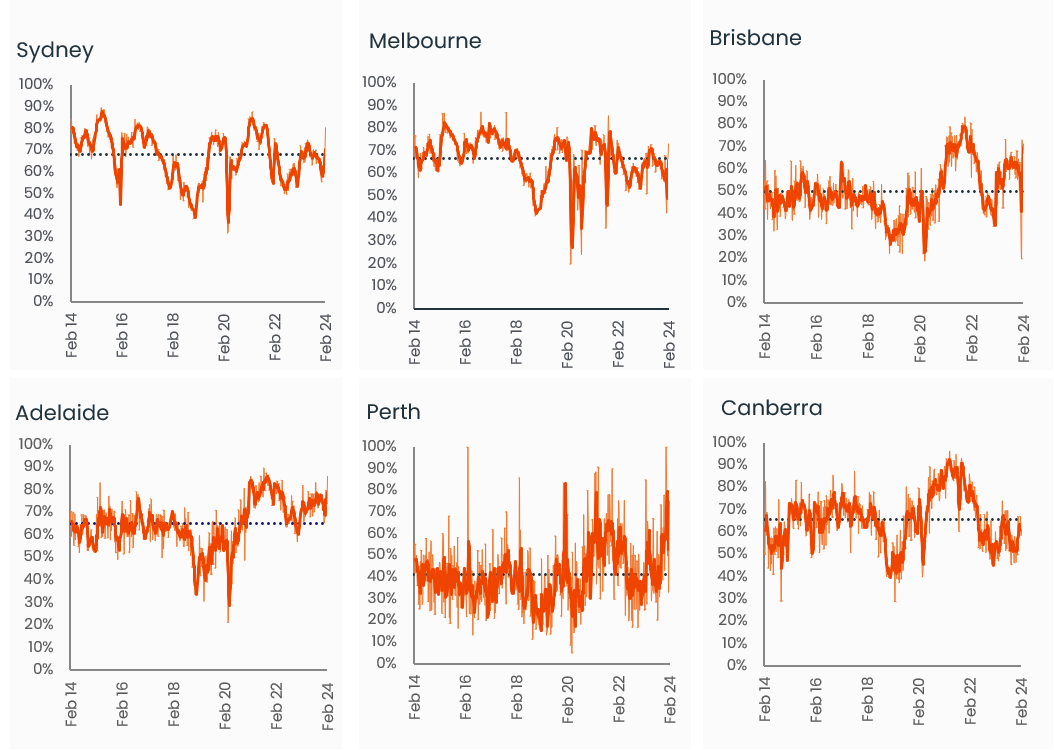
Historical clearance rates utilise the final auction clearance rate, while the current week is based on the preliminary clearance rate.
The newfound strength in auction markets is a radical turnaround from the December results last year, where the preliminary capital city clearance rate fell to the mid 60% range, with final clearance rates dropping to the mid 50% level.
Stronger auction outcomes could be reflective of a boost in sentiment as expectations of an earlier-than-expected interest rate cut become more widespread.
While the early part of the year can show some seasonality, with both the volume of auctions and the clearance rate coming in high over the past two weeks, it looks like the year has started with a much better fit between buyer and seller pricing expectations.
Capital City Auction Statistics (Preliminary)
The above results are preliminary, with ‘final’ auction clearance rates published each Thursday. CoreLogic, on average, collects 99% of auction results each week. Clearance rates are calculated across properties that have been taken to auction over the past week.
Sub-region auction statistics (preliminary)

CoreLogic, on average, collects 99% of auction results each week. Clearance rates are calculated across properties that have been taken to auction over the past week.
Download Property Market Indicator Summary

Meet Caitlin Fono
Sr Associate, Research Support
Caitlin has spent more than a decade working with property data and analytics in various roles, earning a position on the CoreLogic research team in 2013. As a respected and highly experienced research analyst, Caitlin works with high frequency data sets, regularly updating our widely read auction reporting, weekly activity updates and customised data briefs.
Full profile