With 2,723 capital city homes going under the hammer last week, it was the second busiest week of auctions so far this year. The preliminary clearance rate held up well under higher supply, coming in at 74.0%, 1.2 percentage points higher than the previous week’s preliminary clearance rate (72.8% which revised down to 68.0% on final numbers).
Sydney was the only capital city to record a lower preliminary clearance rate, with 74.8% of auctions returning a successful result so far, down from 76.2% over the previous week (revised down to 71.1% on final numbers) and the lowest preliminary clearance rate so far this year. Although the trend in clearance rates has been softening across Sydney, the success rate remains above the decade average of 72.2% on the preliminary rate and 68.1% on the final rate.
Capital City Auction Statistics (Preliminary)
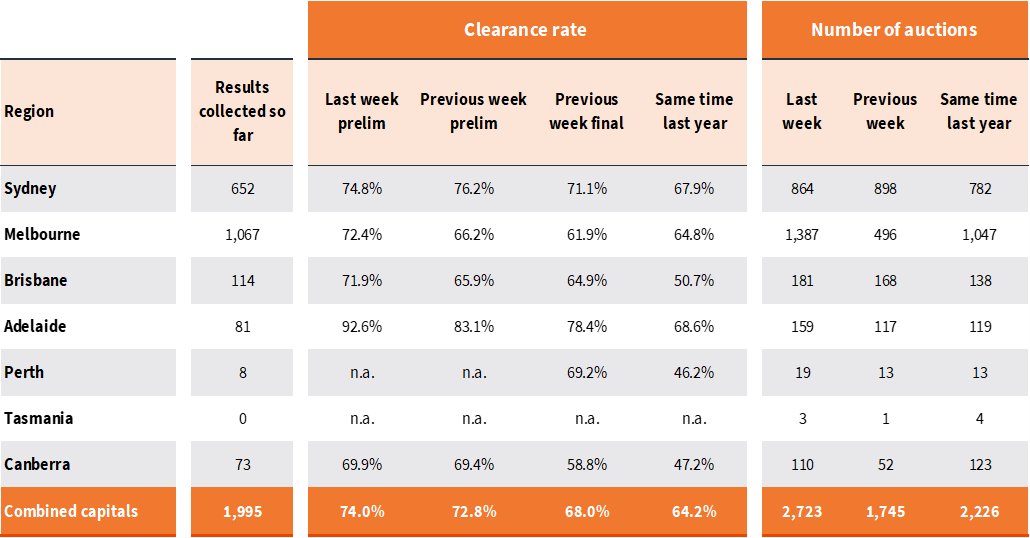
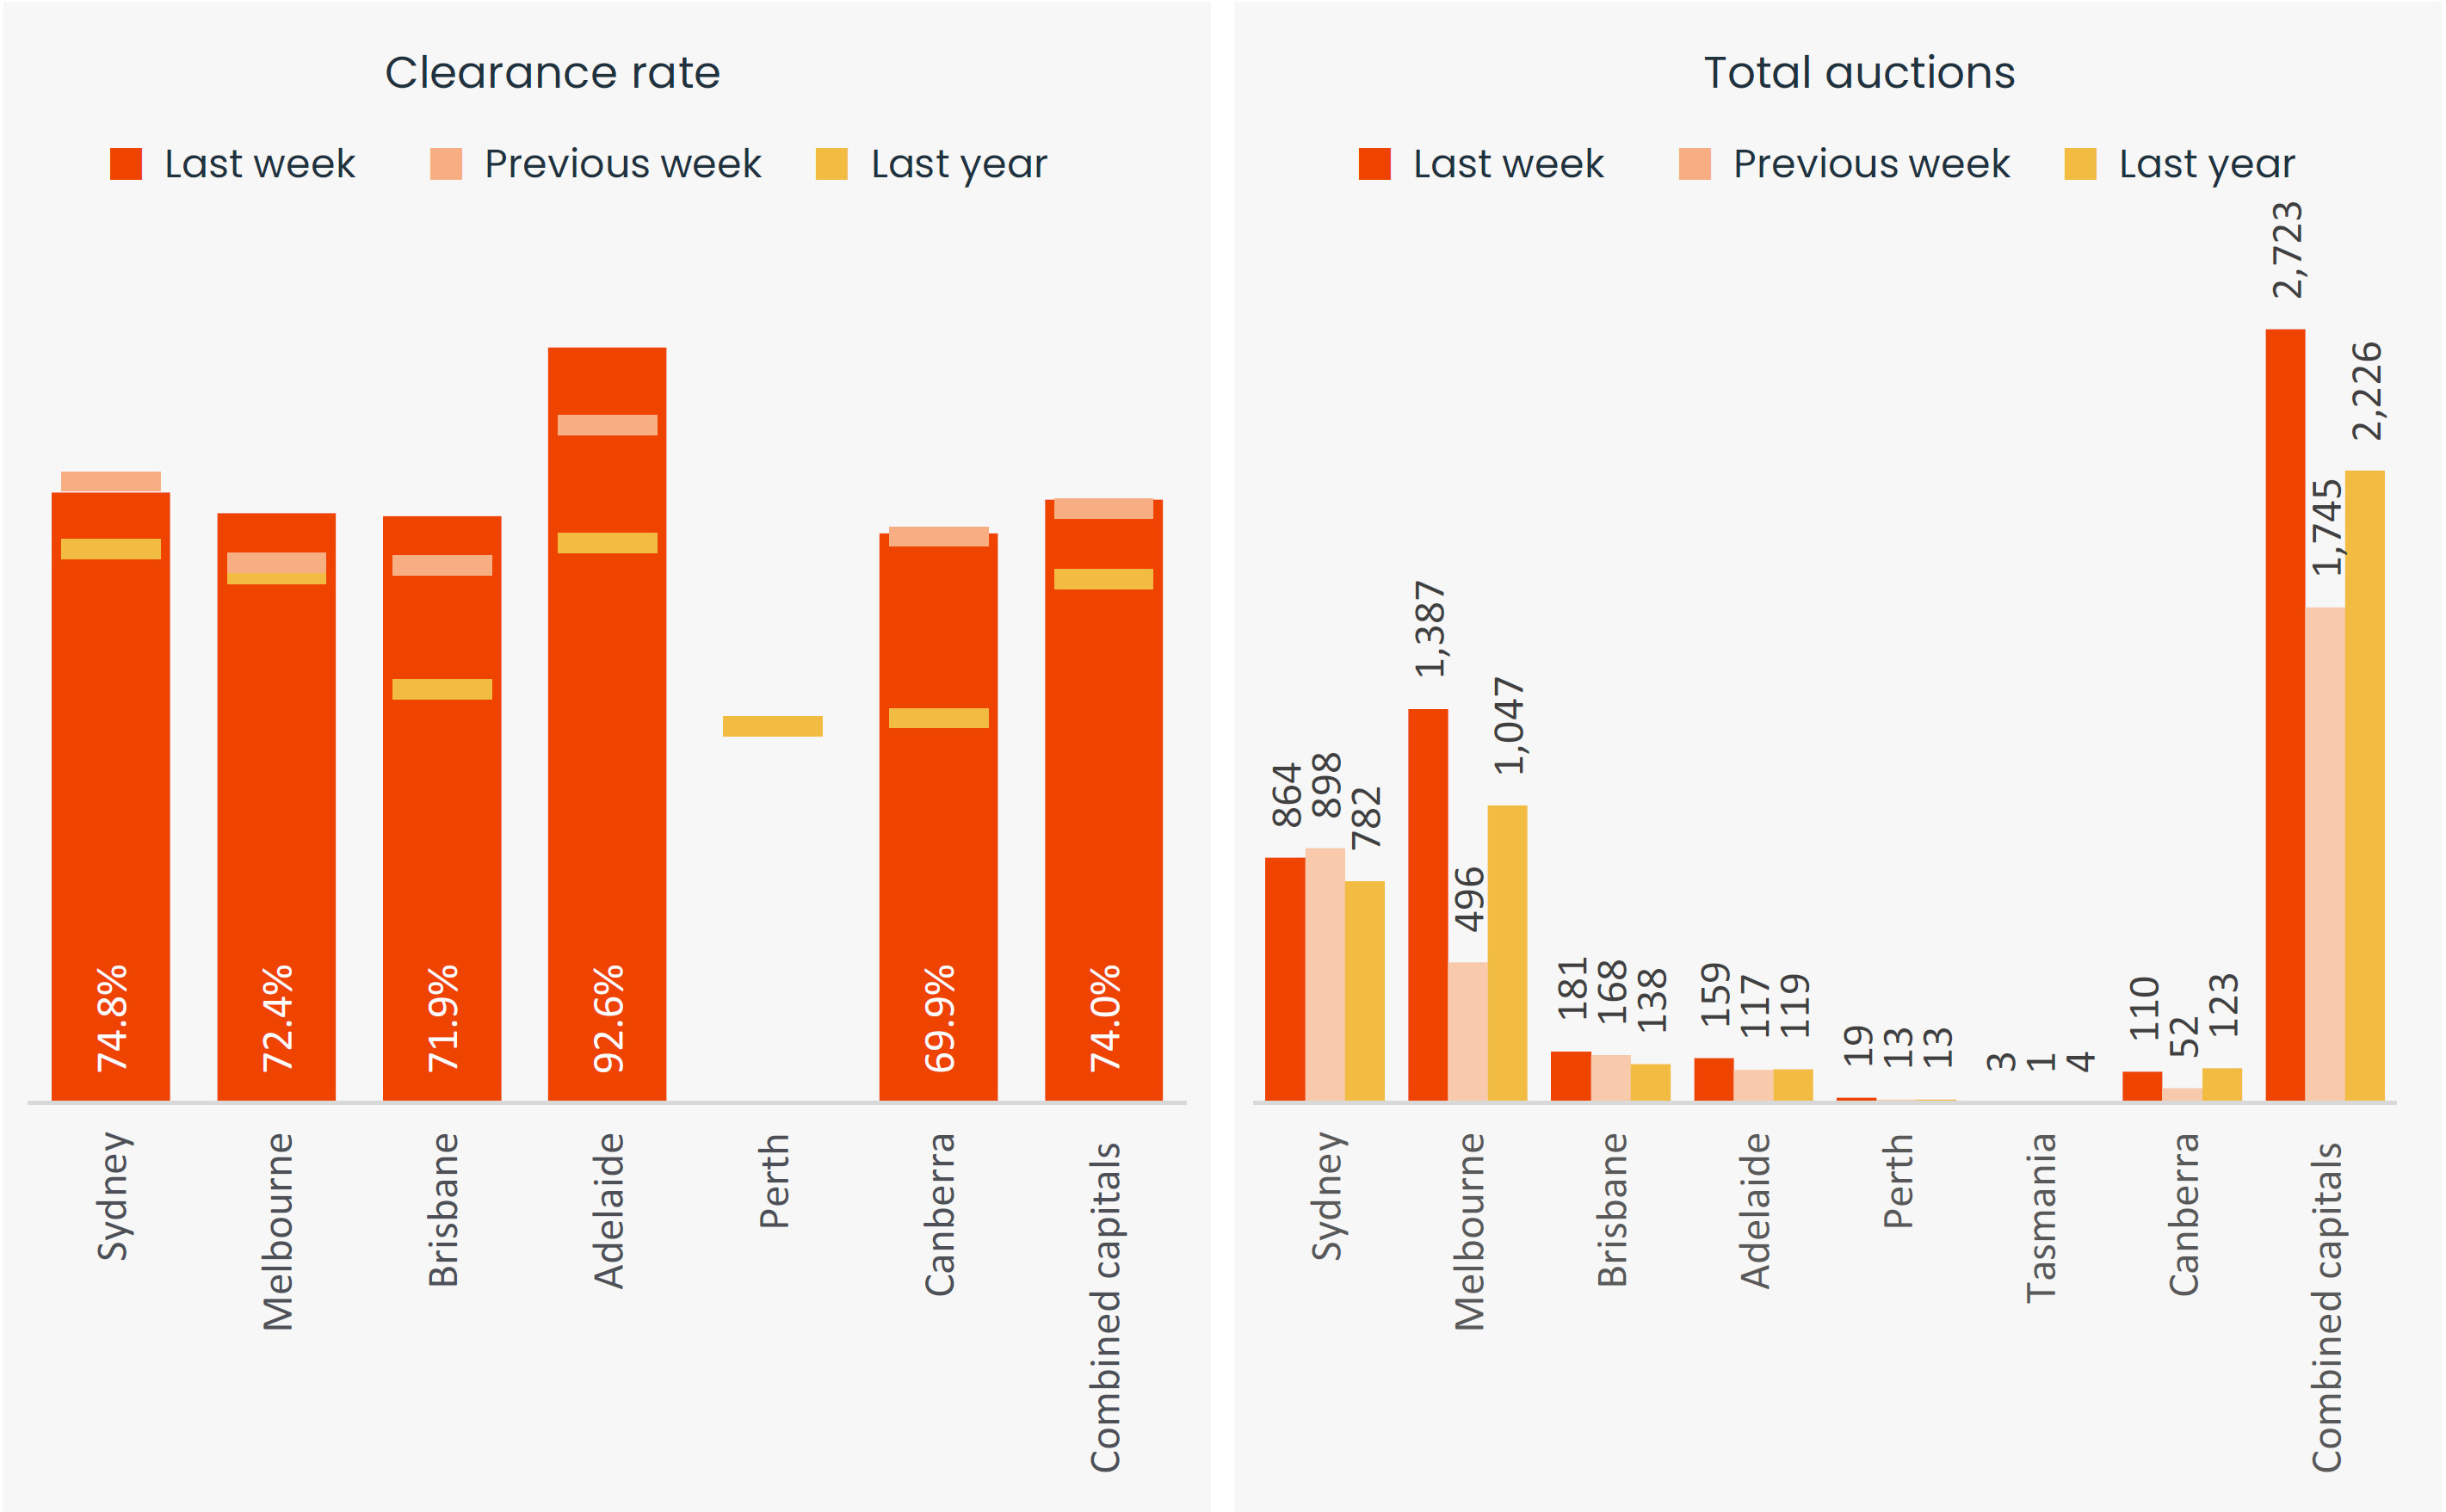
Melbourne’s preliminary clearance rate recorded a solid bounce back, rising to 72.4%, after the previous week’s long weekend saw the preliminary clearance rate drop to 66.2% (revising down to 61.9% on final numbers). Last week’s early result was the second highest so far this year, after the second week of February (73.1%). With 1,387 auctions held, this was also the second highest number of auctions held so far this year.
The preliminary clearance rate was up across the smaller capitals as well, led by Adelaide with a stunning 92.6% preliminary clearance rate. Brisbane’s clearance rate came in at 71.9%, while Canberra’s preliminary clearance rate came in at 69.9%. There were 181 auctions held across Brisbane last week, 159 in Adelaide, 110 in Canberra and 19 in Perth. Four of the eight auctions reported in Perth so far were successful, while we are yet to receive the results of the three auctions in Tasmania.
Capital City Auction Statistics over time
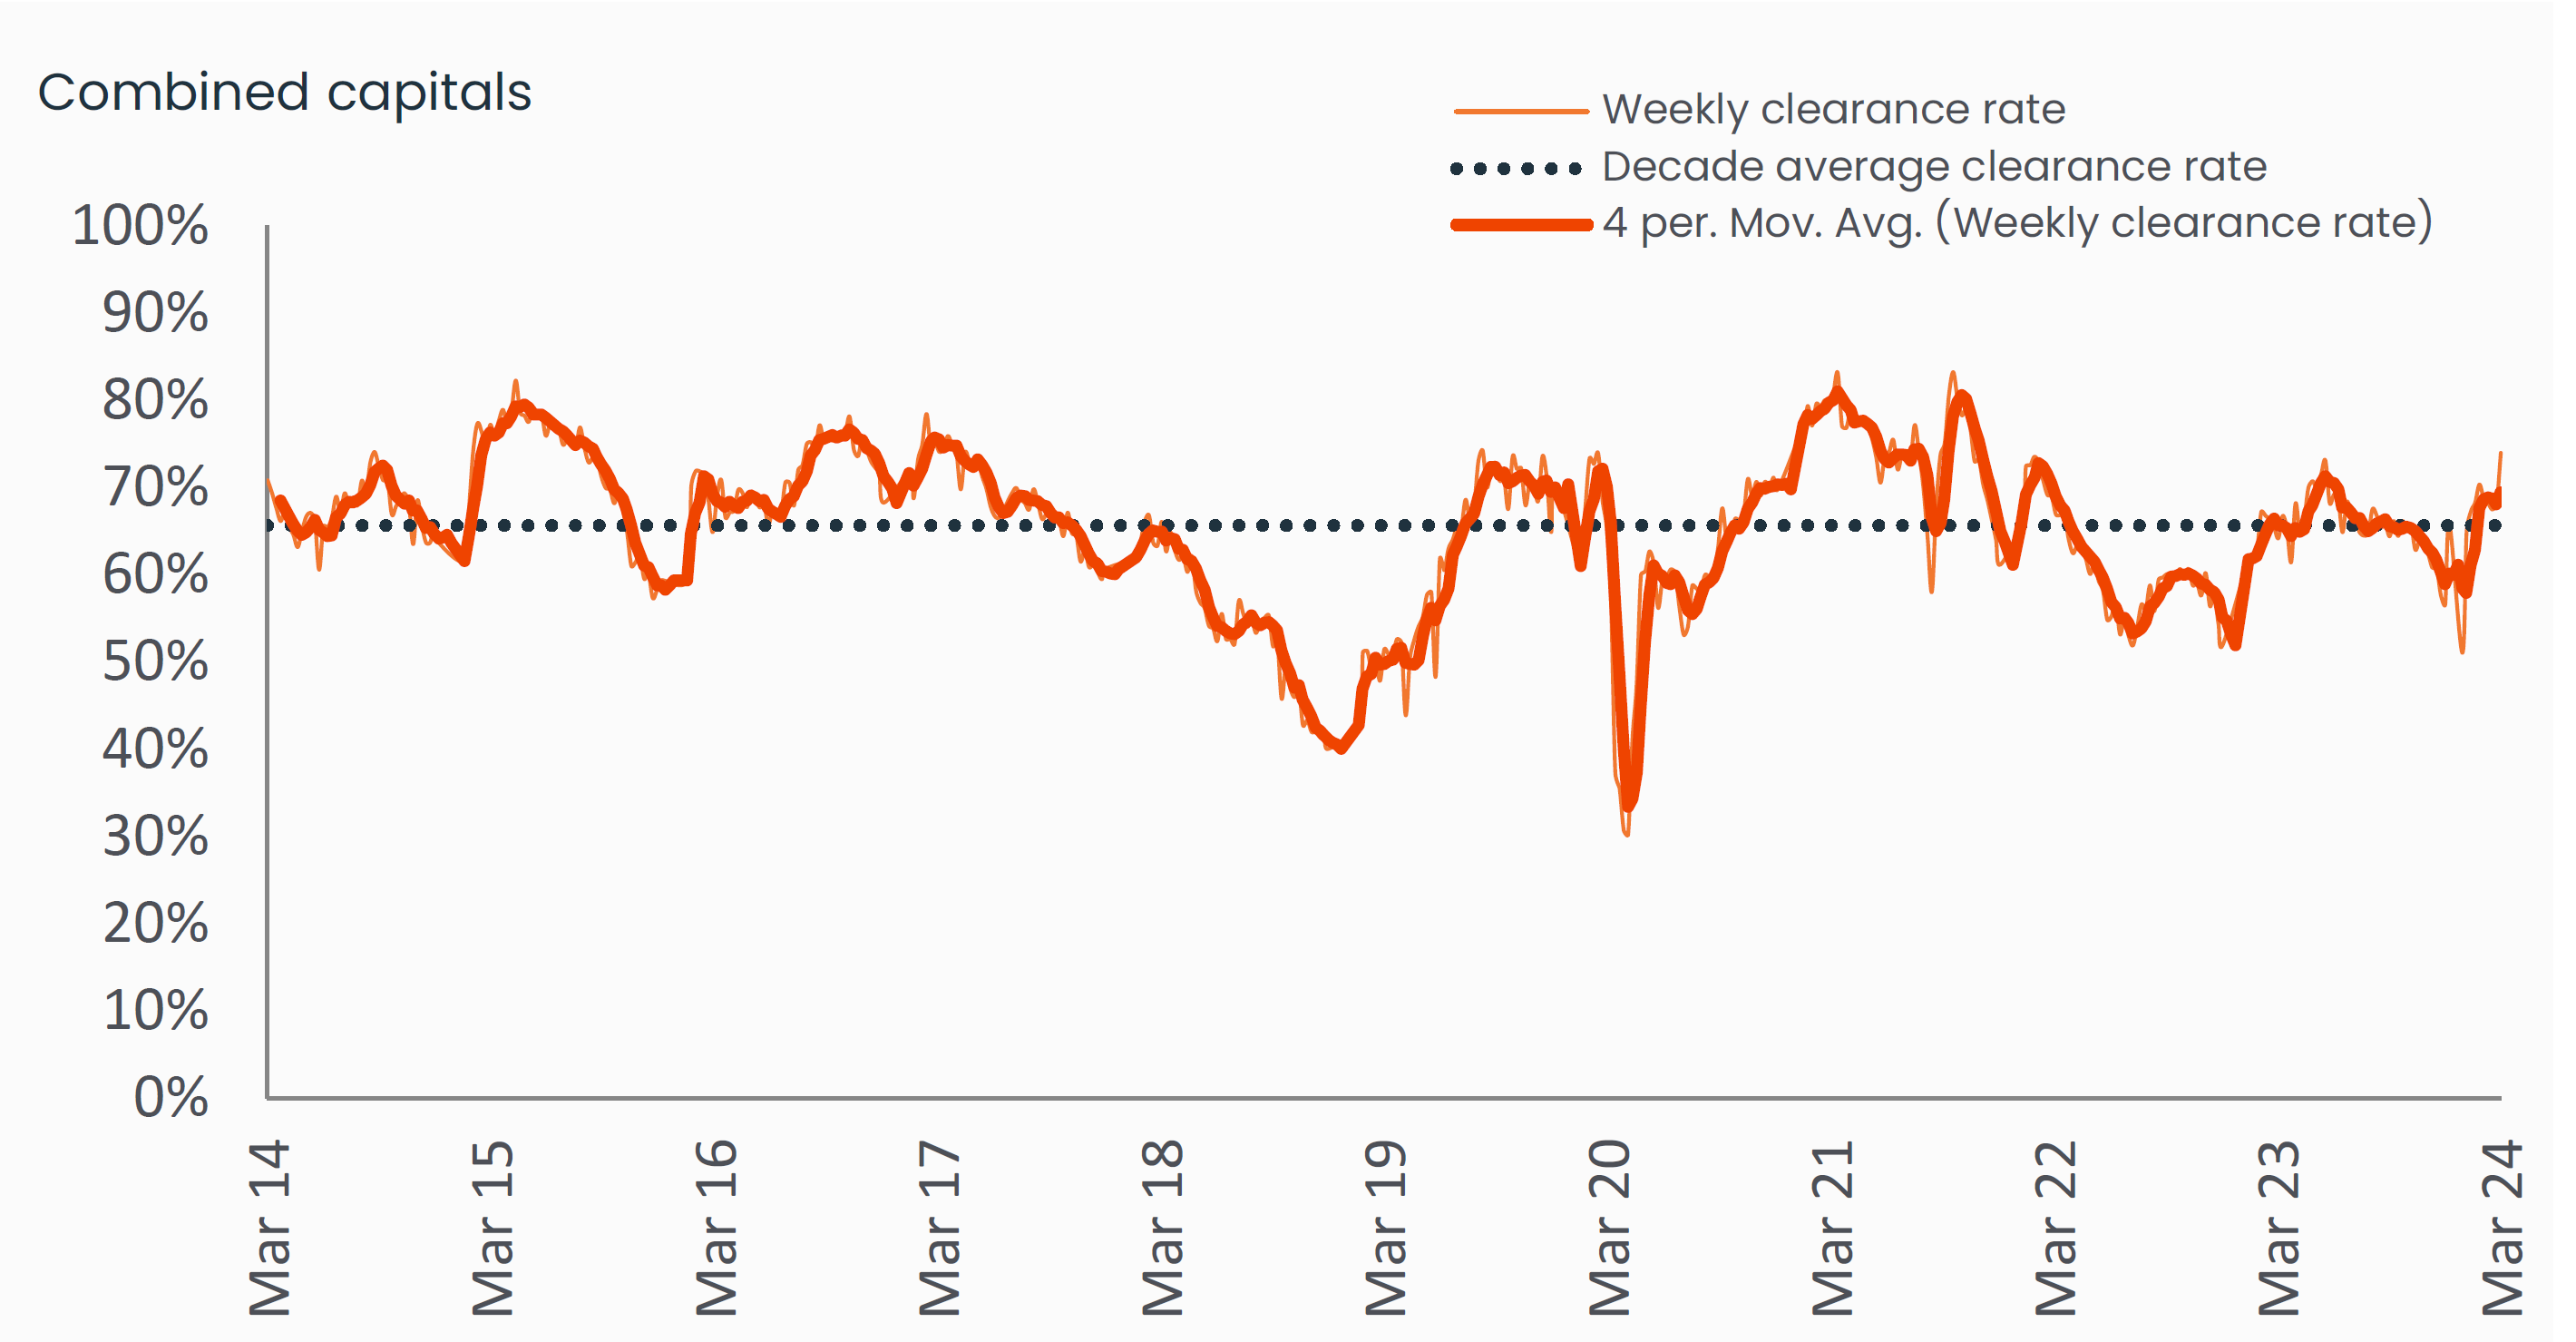
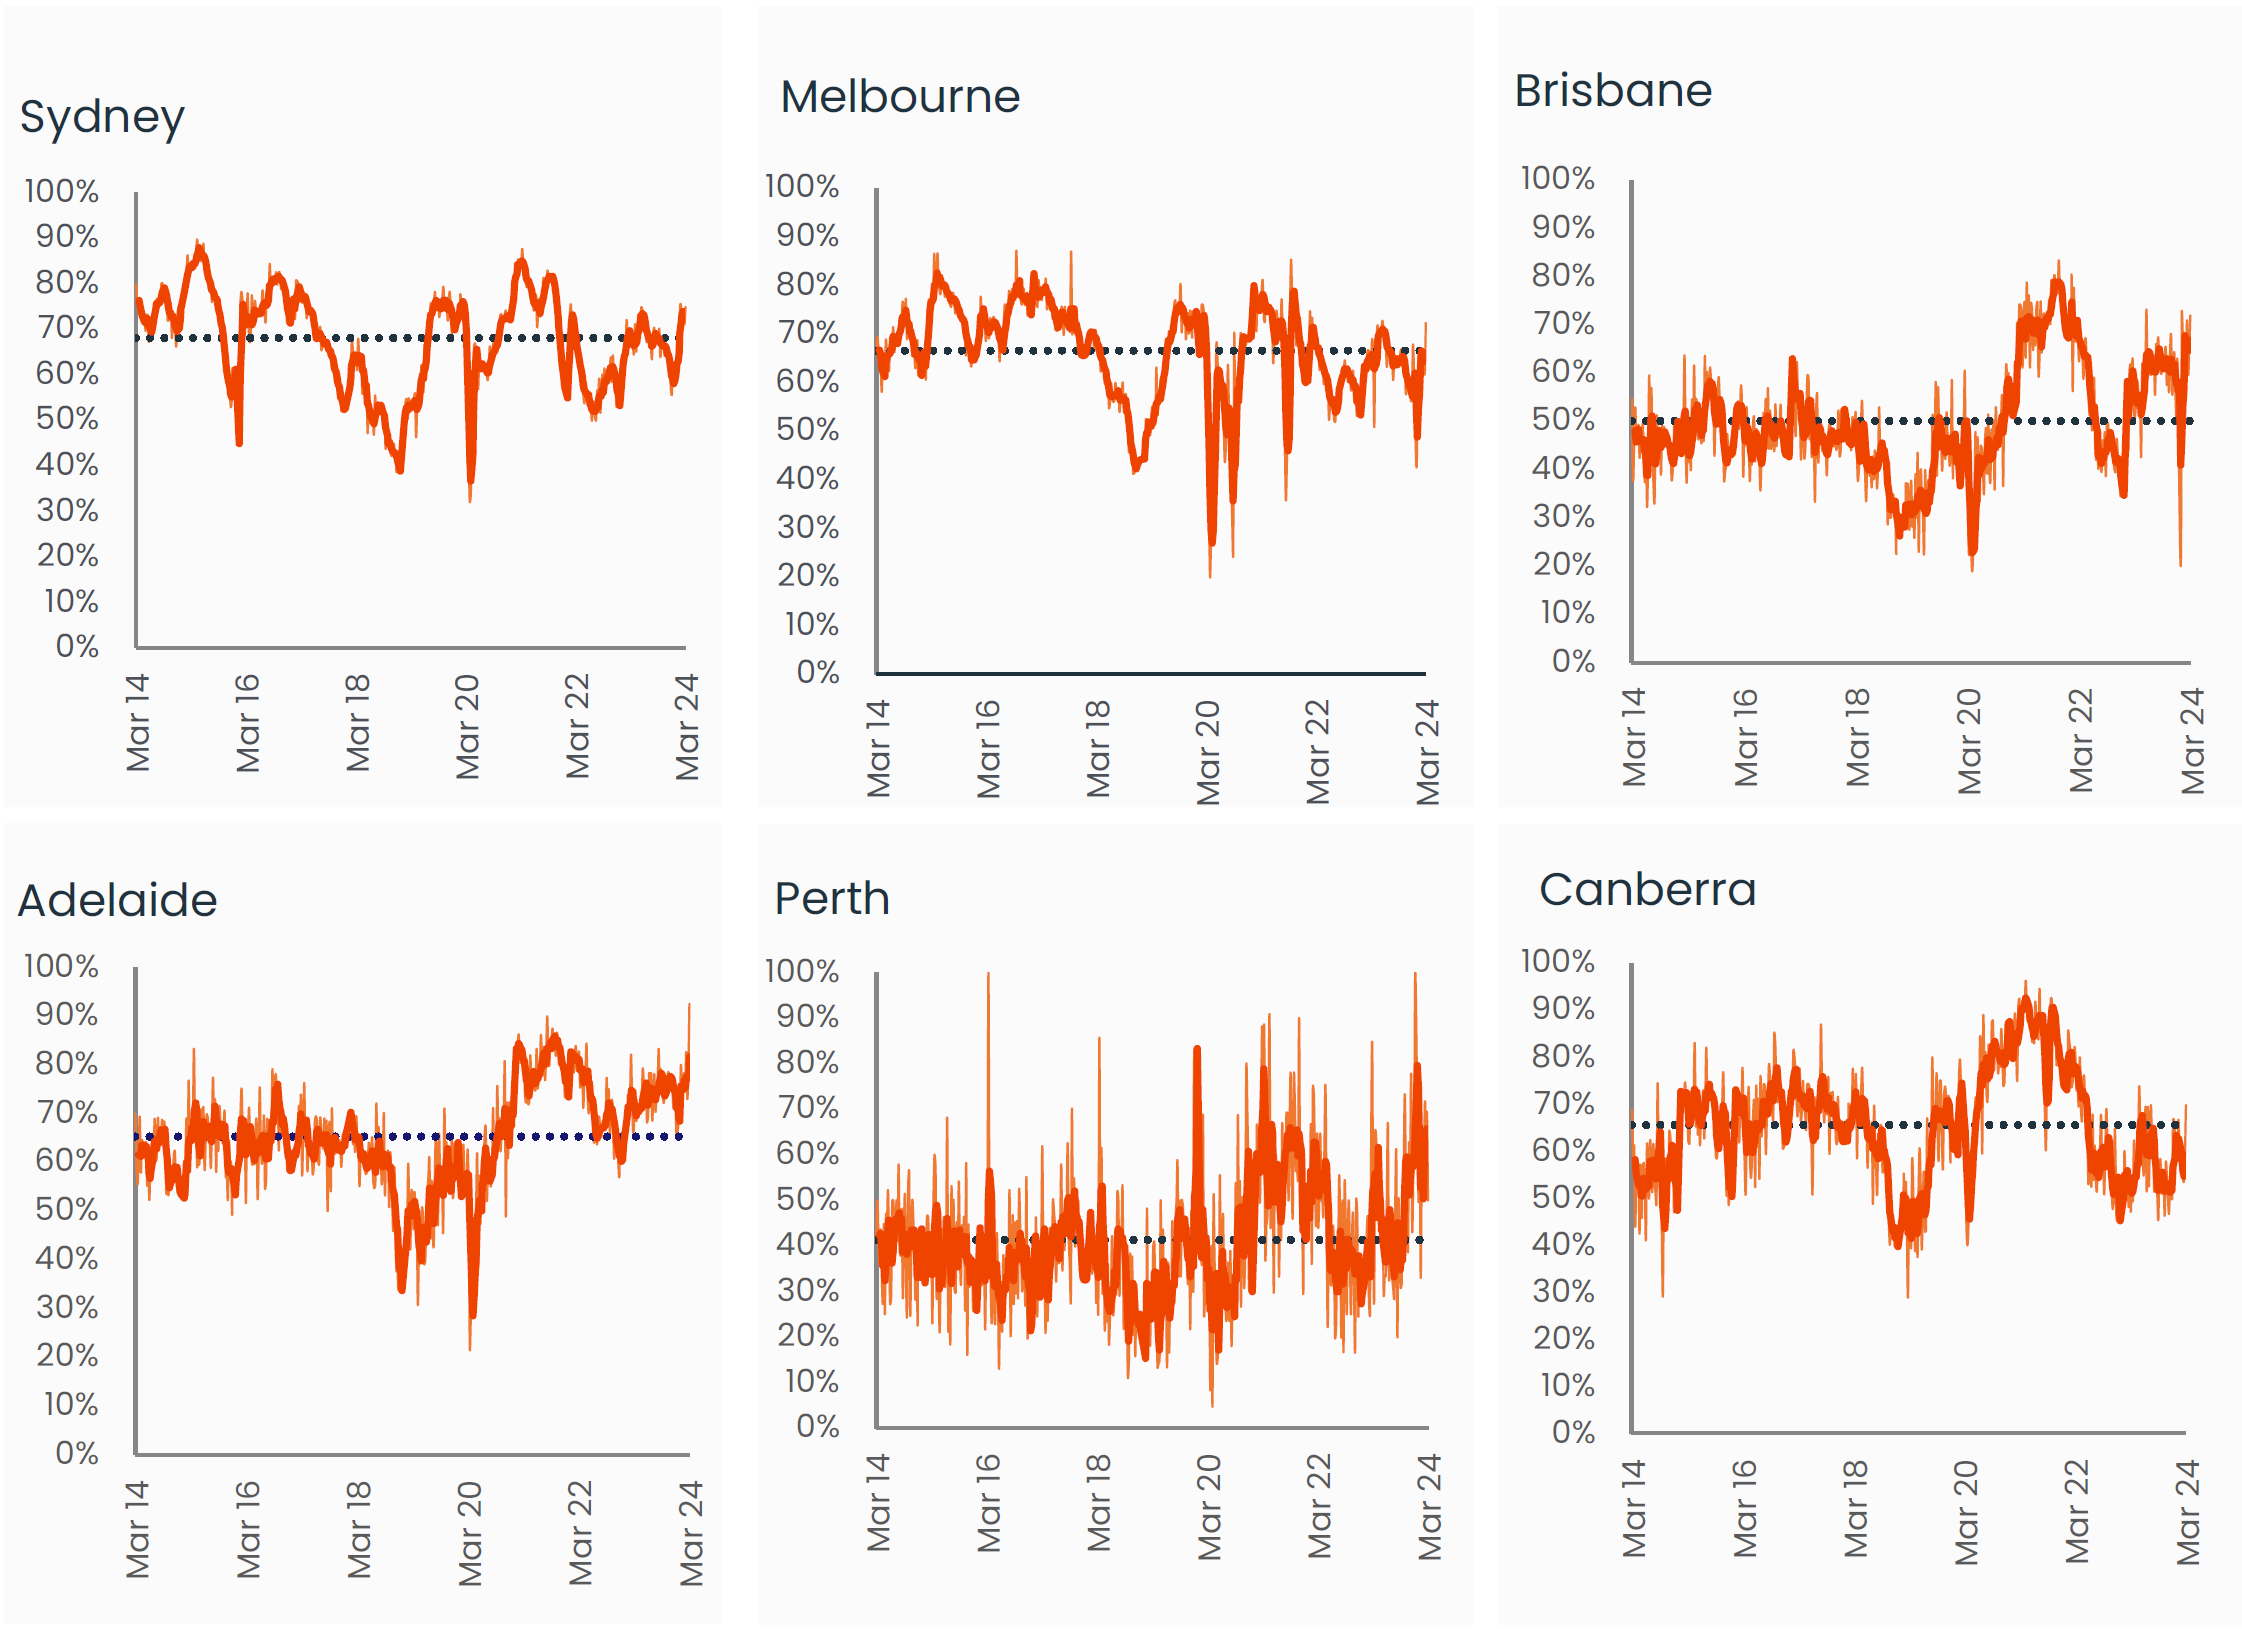
Historical clearance rates utilise the final auction clearance rate, while the current week is based on the preliminary clearance rate.
This week (i.e. the week before Easter) is looking huge for auctions, with around 3,400 homes currently scheduled to go under the hammer. It’s rare to see more than 3,000 capital city auctions in a week… in fact, if the scheduled volume of auctions holds at this level, this week is likely to be the largest volume of auctions held since the week prior to Easter in April 2022.
Capital City Auction Statistics (Preliminary)
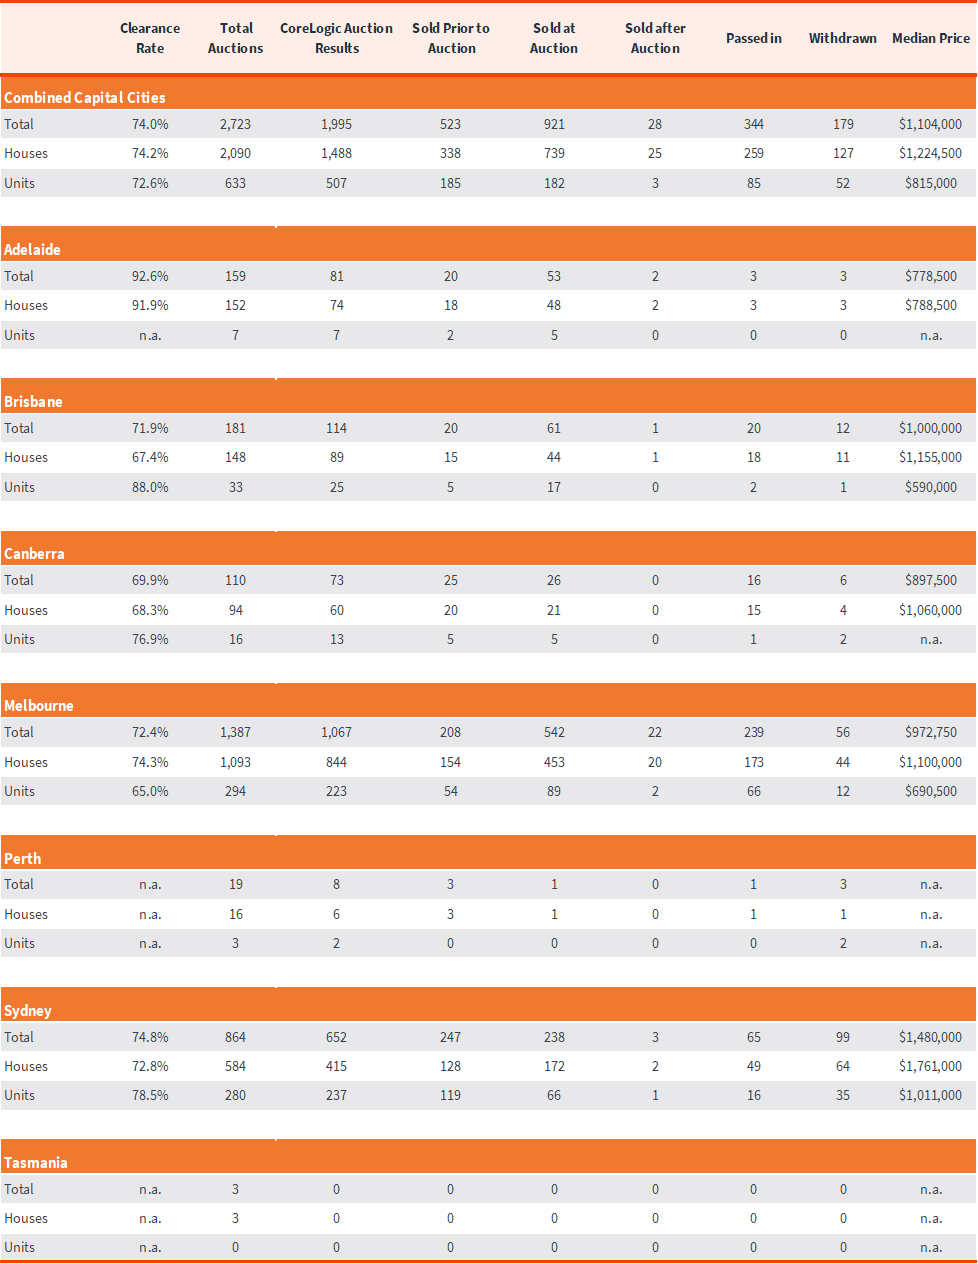
The above results are preliminary, with ‘final’ auction clearance rates published each Thursday. CoreLogic, on average, collects 99% of auction results each week. Clearance rates are calculated across properties that have been taken to auction over the past week.
Sub-region auction statistics (preliminary)
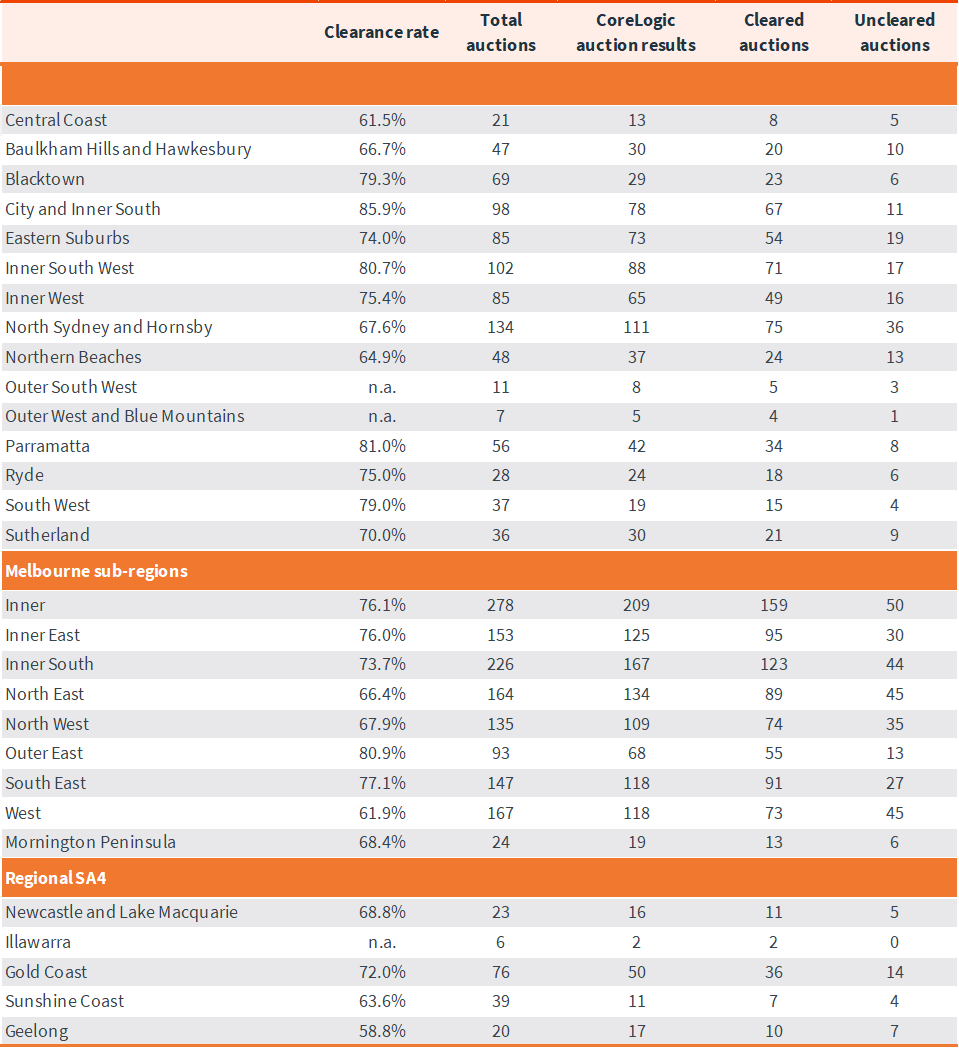
CoreLogic, on average, collects 99% of auction results each week. Clearance rates are calculated across properties that have been taken to auction over the past week.
Download Property Market Indicator Summary

Meet Caitlin Fono
Sr Associate, Research Support
Caitlin has spent more than a decade working with property data and analytics in various roles, earning a position on the CoreLogic research team in 2013. As a respected and highly experienced research analyst, Caitlin works with high frequency data sets, regularly updating our widely read auction reporting, weekly activity updates and customised data briefs.
Full profile