The preliminary combined capitals clearance rate recorded a solid bounce last week, rising to 75.9% from 71.1% the previous week (revised down to 64.8% once finalised which was the lowest auction clearance rate so far this year excluding the volatility from early-to-mid January). Last week’s preliminary clearance rate was the highest since the week ending February 11th earlier this year.
The higher early success rate was broad based, with most cities recording a rise from the Easter low. Melbourne recorded the largest increase, rising 7.6 percentage points to 70.6% (from 63.0% the previous week, revising down to 60.3% on final numbers). Sydney also recorded a solid rise from Easter, with a preliminary clearance rate of 81.6% (highest since the week ending February 18 at 81.7%), up from 77.8% the previous week which revised down to a final clearance rate of 68.8%.
Capital City Auction Statistics (Preliminary)
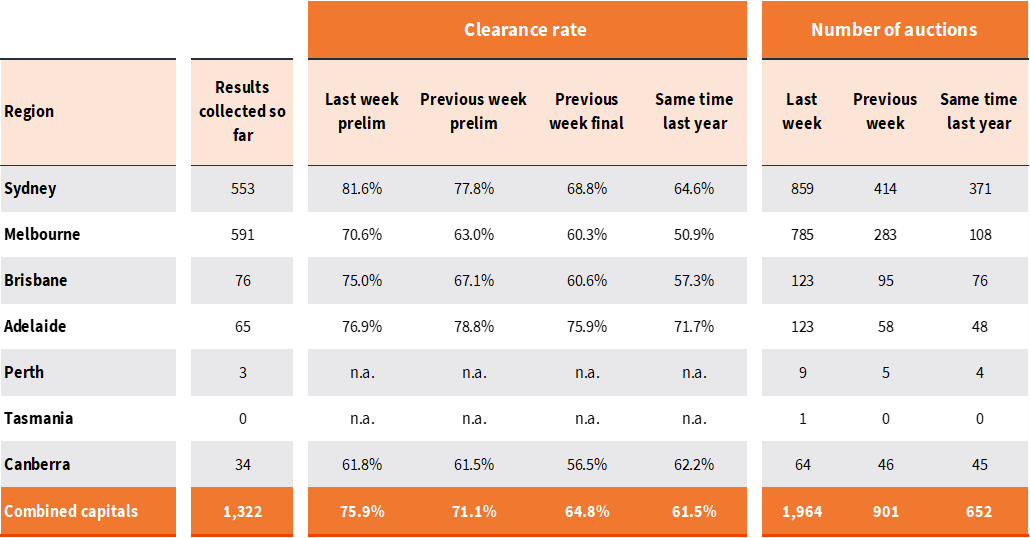

Canberra was the only capital city to record a preliminary clearance rate below 70%, coming in at 61.8%.
The volume of auctions (1,964) was more the double the previous week (901), but well below the lead up to Easter where 3,519 homes were taken to auction in the week prior to Easter.
Early indicators show a similar number of capital city auctions scheduled for this week at around 2,000.
Capital City Auction Statistics over time
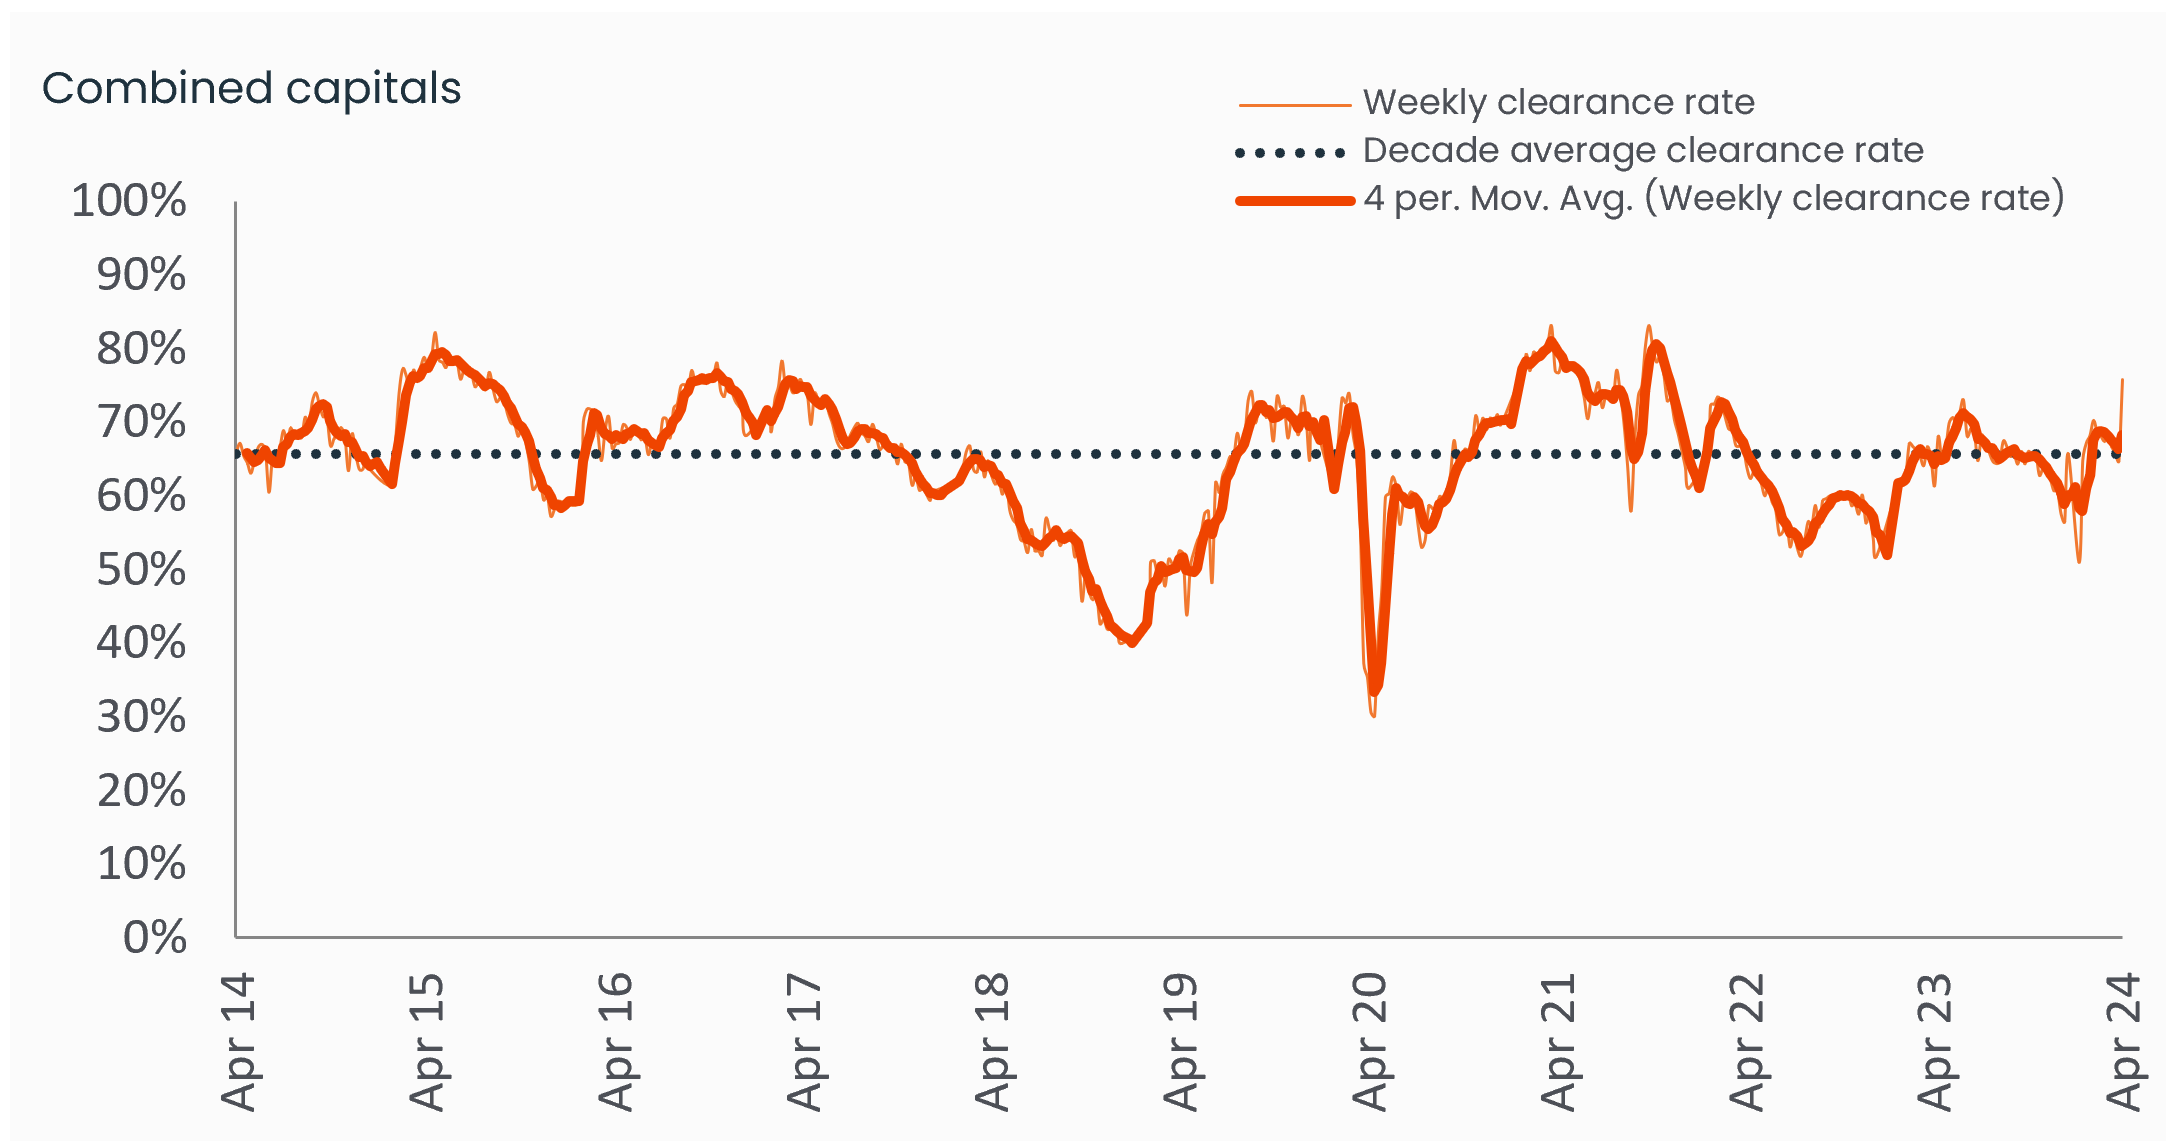
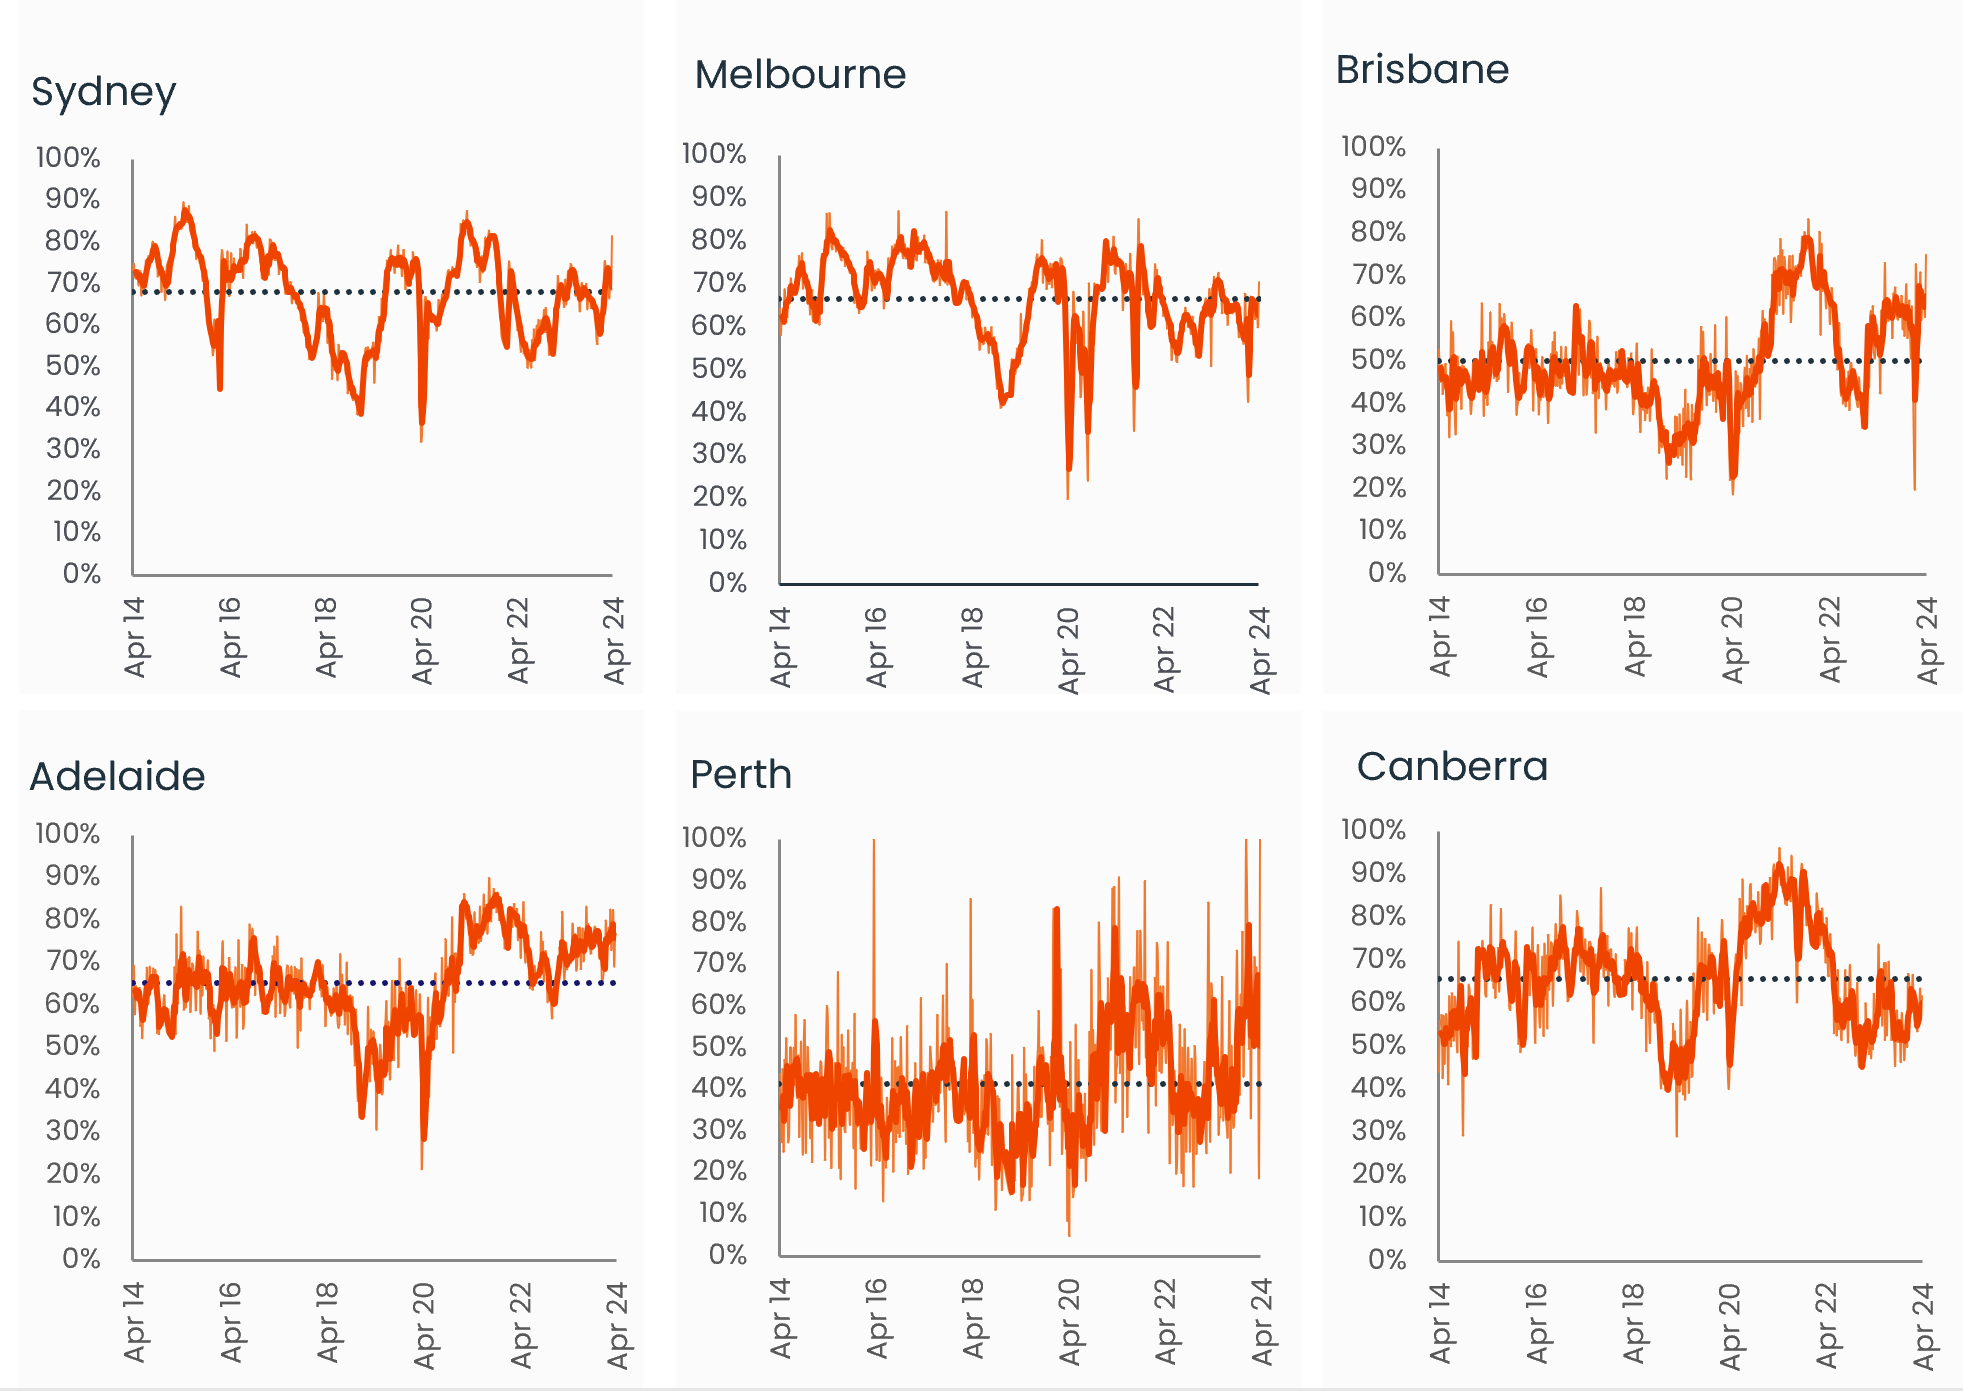
Historical clearance rates utilise the final auction clearance rate, while the current week is based on the preliminary clearance rate.
Capital City Auction Statistics (Preliminary)
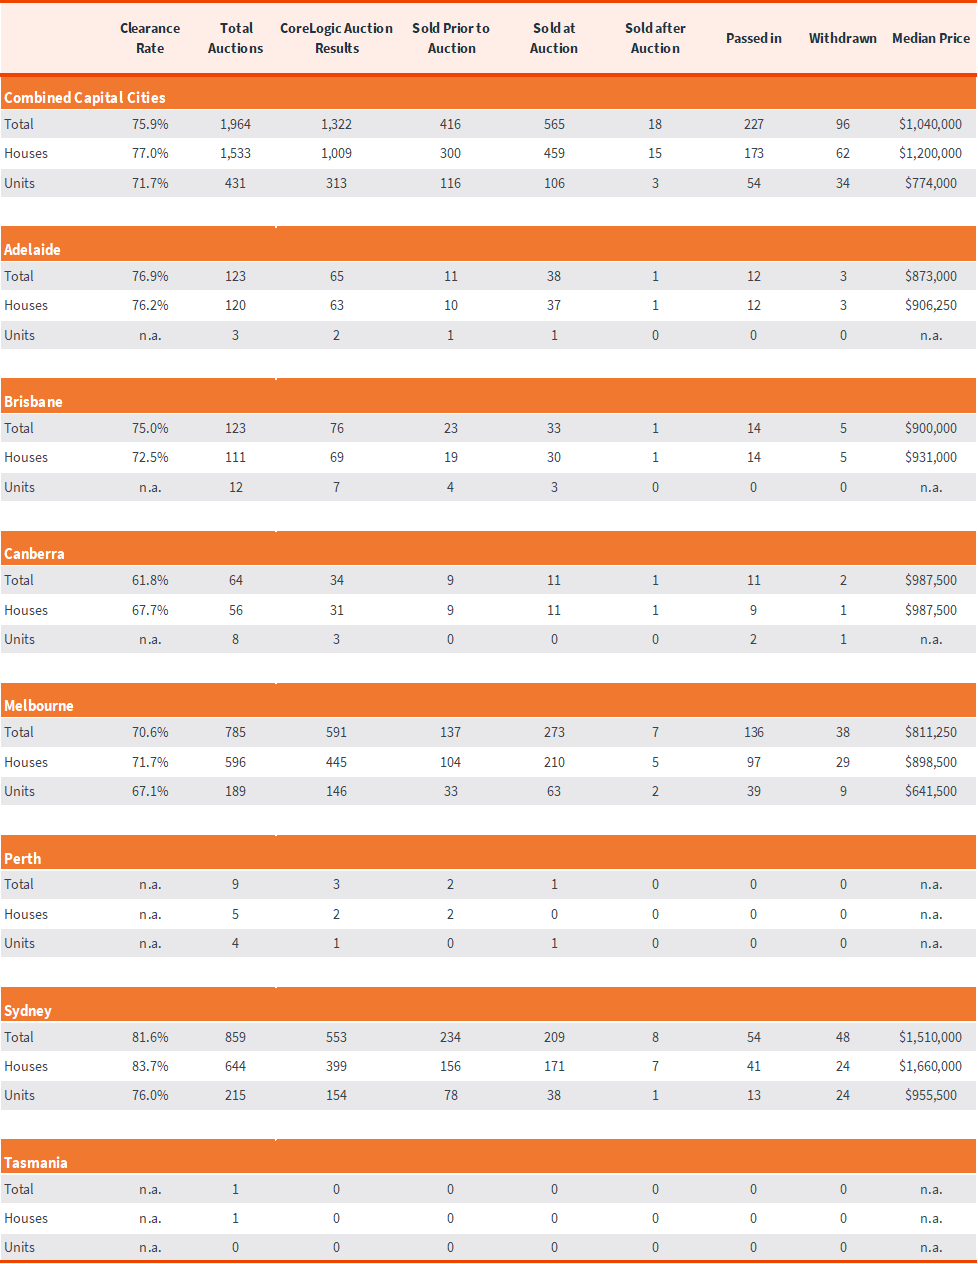
The above results are preliminary, with ‘final’ auction clearance rates published each Thursday. CoreLogic, on average, collects 99% of auction results each week. Clearance rates are calculated across properties that have been taken to auction over the past week.
Sub-region auction statistics (preliminary)
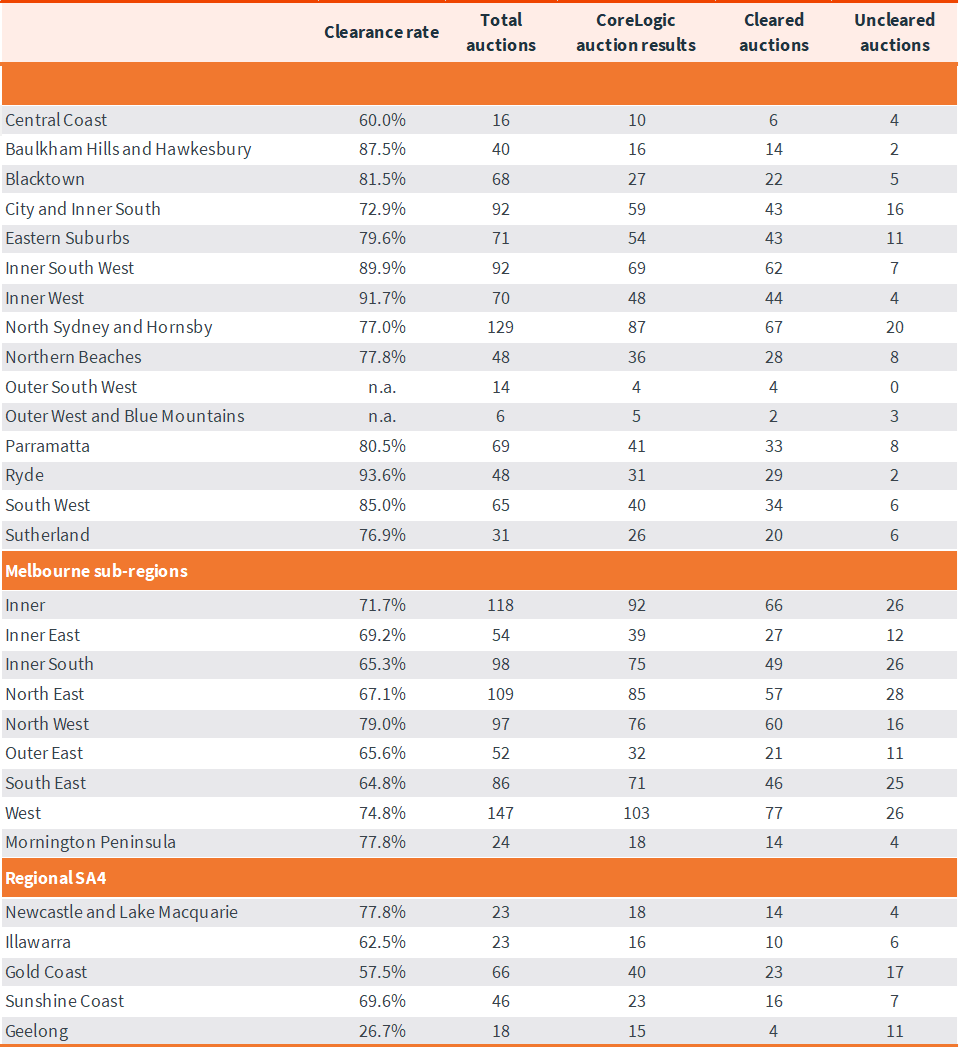
CoreLogic, on average, collects 99% of auction results each week. Clearance rates are calculated across properties that have been taken to auction over the past week.
Download Property Market Indicator Summary

Meet Caitlin Fono
Sr Associate, Research Support
Caitlin has spent more than a decade working with property data and analytics in various roles, earning a position on the CoreLogic research team in 2013. As a respected and highly experienced research analyst, Caitlin works with high frequency data sets, regularly updating our widely read auction reporting, weekly activity updates and customised data briefs.
Full profile