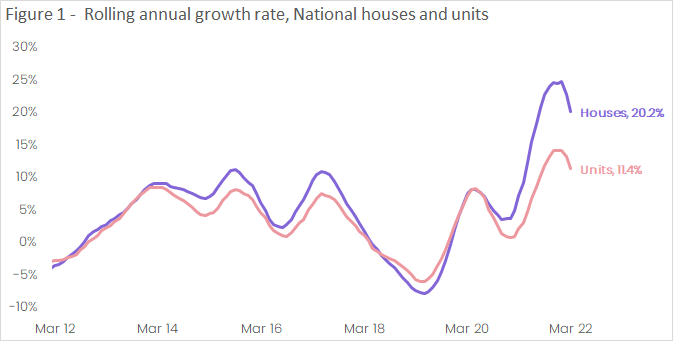
CoreLogic's monthly Unit Market Update shows the annual performance gap between houses and units fell to 8.7% in March as both markets slipped further from their peak rate of growth recorded in January.
At the national level, units recorded a 0.3% rise in values over March, in line with the growth rates recorded in January and February, resulting in a first quarter appreciation of 0.9%. This is equivalent to a $5,464 increase in median unit values through the quarter. National house values rose 0.8% in March and 2.8% over the three months to March, thanks in part to strong growth in QLD and SA. The rise in house values through the quarter was equivalent to a rise of $21,690 in median values.
While national houses are still recording stronger value growth compared to units, houses have also recorded a faster deceleration in the pace of quarterly growth. Since reaching a cyclical peak in May 2021, the pace of quarterly house growth has recorded a 4.9 percentage point fall, compared to a 3.8 percentage point fall for unit quarterly growth. Similarly, the slowdown in values can be seen in the annual growth trend shown in Figure 1, with both houses and units moving into a downswing trend after recording cyclical peaks in January.
Coming off the back of strong annual growth, affordability continues to be a key factor affecting market conditions. Amid higher inflation and the rising cost of living, prospective buyers are finding it harder to save for a deposit, while the amount required for a deposit has also increased. Assuming a 20% deposit level, the average house deposit has increased by approximately $36,000 over the past two years, while the typical unit deposit has increased by around $15,000. As noted in previous CoreLogic research, increasing investment in higher density dwellings has a significant role to play in alleviating affordability concerns, because higher density housing is generally more affordable. Additionally, increased housing density across key transport lines can help maximise the efficiency and use of infrastructure.
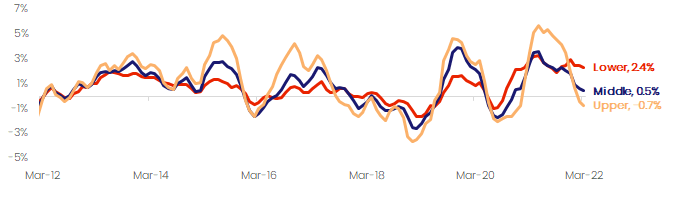
The softer market conditions have not impacted all markets and value segments equally. Over the month of March, growth in houses was 0.5% across the combined capital cities, outperforming units (which were steady over the month). However, combined regional house and unit values both recorded a monthly appreciation of 1.7%. While capital city unit values remained flat over the month, the lower quartile of unit values recorded a modest rise of 0.9%, while the middle and upper segments recorded value changes of 0.2% and -0.5% respectively. Historically, the upper quartile value trend has been more volatile with higher peaks and deeper troughs.
Figure 2 shows the rolling quarterly growth rate for combined capital city units by value segment. Over the three months the March, upper quartile unit values fell by -0.7%, while the middle and lower quartiles both recorded positive quarterly growth (0.5% and 2.4% respectively).
Figure 2 - Rolling quarterly growth rate in stratified Home Value Index – combined capital city units
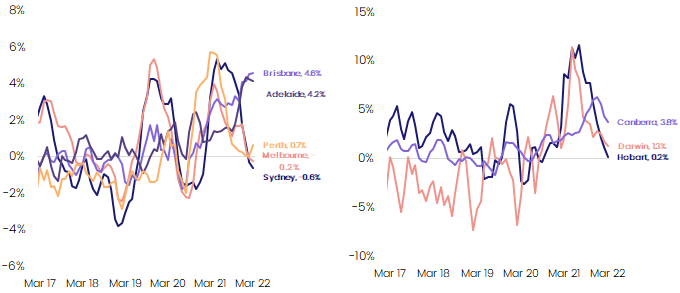
A similar trend can be seen across the individual capital cities. Unit values are beginning to record quarterly declines across the more expensive cities of Sydney (-0.6%) and Melbourne (-0.2%), while relatively cheap cities like Brisbane and Adelaide are still recording quarterly growth above 4%. With a median value of $833,815, the typical Sydney unit is approximately $355,000 more than the typical Brisbane unit, and more than double the price of the average Adelaide unit. At the suburb level, 51.4% of Sydney's unit markets analysed in CoreLogic’s Mapping the Market Report recorded a decline in values over the first quarter, with a number of the largest falls recorded in the city's Northern Beaches region. Across Melbourne, 58.0% of the unit markets analysed recorded a decline in values, with the largest value declines recorded across the inner-city markets.
Brisbane continues to be the stand out performer amongst the capital city unit markets, recording a new cyclical high in monthly (1.6%), quarterly (4.6%) and annual growth rates (15.1%) in March. The typical Brisbane unit recorded a $63,000 rise in values over the past 12 months. Just one Brisbane suburb recorded a fall in unit values over the first quarter of the year.
While Adelaide units continue to record strong monthly growth rates, quarterly growth appears to be slowing, with the pace of quarterly growth decreasing from 4.4% in January to 4.2% over the three months to March. Perth has recorded a surprise reversal in its quarterly growth trend, with the reopening of the WA border potentially pushing unit values 0.7% higher over the three months to March. While quarterly growth has remained positive across Hobart, Darwin and Canberra, the pace of growth continued to ease over March.
Figure 3 - Rolling quarterly growth rate - Capital city units
Regional markets
Regional unit markets continue to show some resilience in the face of slowing market conditions, with each ‘rest of state’ market recording positive unit value growth over the quarter. Regional Qld continued to lead the pace of growth, recording a quarterly unit value increase of 5.9%, followed by regional WA (4.3%), regional Victoria (3.8%) and Regional NSW (3.6%). At the other end of the spectrum, regional SA units recorded the smallest increase in values, rising just 0.5% over the quarter, while regional Tasmanian unit values rose by 1.7%. While monthly unit and house growth were on par at the combined regionals level, four of the six ‘rest of state’ regions recorded stronger unit growth than houses.
Unit market outlook
Looking forward, appreciation of property values is seeing more headwinds than tailwinds, though the unit segment may be more resilient relative to houses as the Australian property market inches toward the downswing phase of the cycle. Housing affordability constraints, rising mortgage rates and the possibility of a lift in the cash rate over the next few months could see less buyer demand throughout the year. However, unit capital growth cycles have historically seen less volatility than houses, and as a result the downswing in prices is expected to be less than that in the detached house segment.
Unit stock is also generally more affordable relative to detached houses in the same area, and a downturn in demand may be partially offset by the fact that units are a more viable option amid housing affordability constraints. Finally, it is clear that the investment proposition for units is becoming slightly more favorable in terms of rental return. Unit rents are currently rising faster than capital growth, and faster than detached house rents. Gross rental yields seem to have bottomed out in some cities, and are now rising. This may at least in part be due to relaxed restrictions around international travel earlier this year, where overseas arrivals tend to be renters, and tend to be concentrated in densely populated parts of cities.

Meet Kaytlin Ezzy
Economist
Kaytlin Ezzy is an Economist at CoreLogic, Australia’s leading property data, information, analytics and services provider.
Full profile