The preliminary capital city clearance rate came in at 74.4% last week, up 1.7 percentage points relative to the previous week (72.7% which revised down to 65.2% once finalised). The combined capitals preliminary clearance rate has consistently held above 71% through the year to-date, with a low of 71.1% in the last week of March to a high of 76.2% over the week ending February 11th.
Sydney and Melbourne both recorded a preliminary clearance rate in the early 70% range, at 73.8% and 72.7% respectively, with finalised clearance rates tracking lower in Melbourne, holding below 63% over the past four weeks, while Sydney’s final clearance rates have held in the high 60% to low 70% range. A similar trend is reflected in the pace of value growth, with CoreLogic’s daily HVI up 0.4% in Sydney over the past four weeks while the index for Melbourne is virtually flat (-0.1%).
Capital City Auction Statistics (Preliminary)
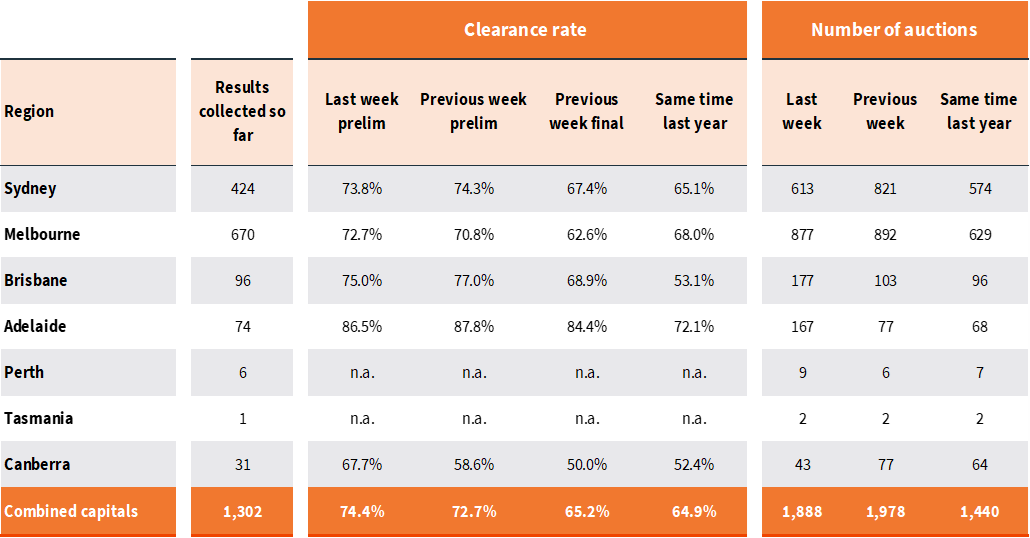
Across the smaller auction markets, Adelaide continues to stand out with an early clearance rate of 86.5%, similar to the week prior (87.8% which revised down to 84.4%). Brisbane’s preliminary clearance rate was 75.0% and Canberra came in at 67.7%.
The past four weeks has seen the preliminary auction clearance rate average 73.5%, a little lower than the first four weeks of the auction season (74.8%), but substantially higher relative to last four weeks of the 2023 auction season (66.7%).
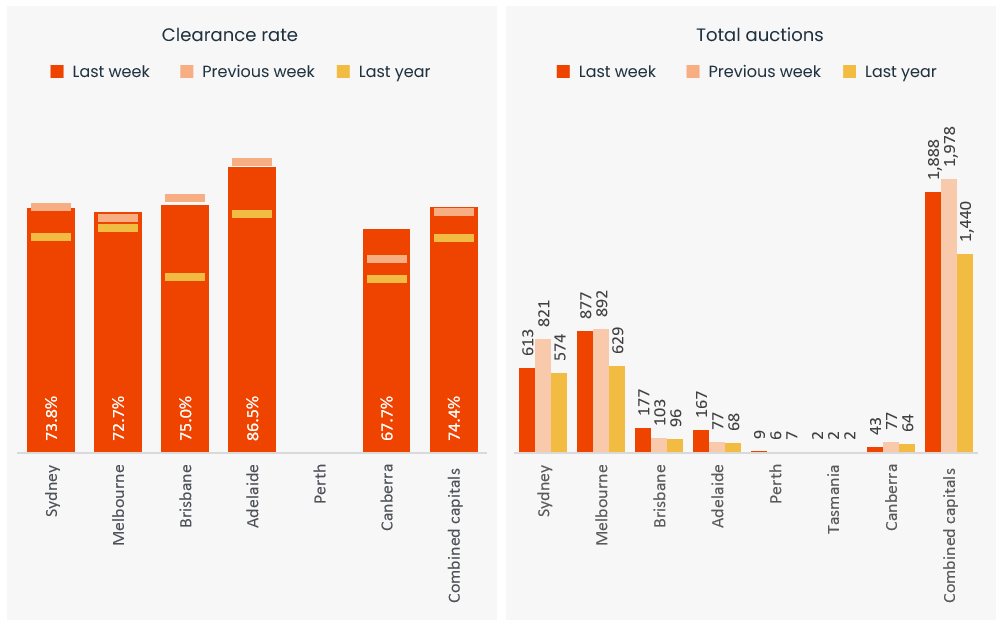
Capital City Auction Statistics over time
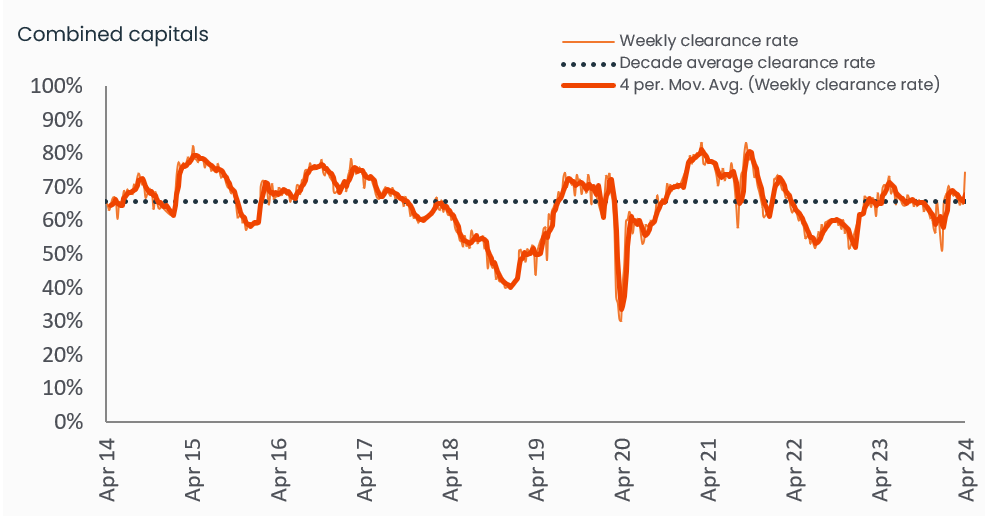
Historical clearance rates utilise the final auction clearance rate, while the current week is based on the preliminary clearance rate.
The past four weeks has also seen the preliminary auction clearance rate revise lower by an average of 7.3 percentage points, with the final clearance rate recording a low of 64.8% in the last week of March and a high of 70.3% over the week ending February 11th.
With 1,888 auctions held last week, activity across the auction market has drifted lower which is seasonally ‘normal’ post-Easter. Apart from long weekend disruptions, this was the lowest number of weekly auctions held since the week ending February 11th. This week around 1,900 properties are currently scheduled to go under the hammer.
Capital City Auction Statistics (Preliminary)
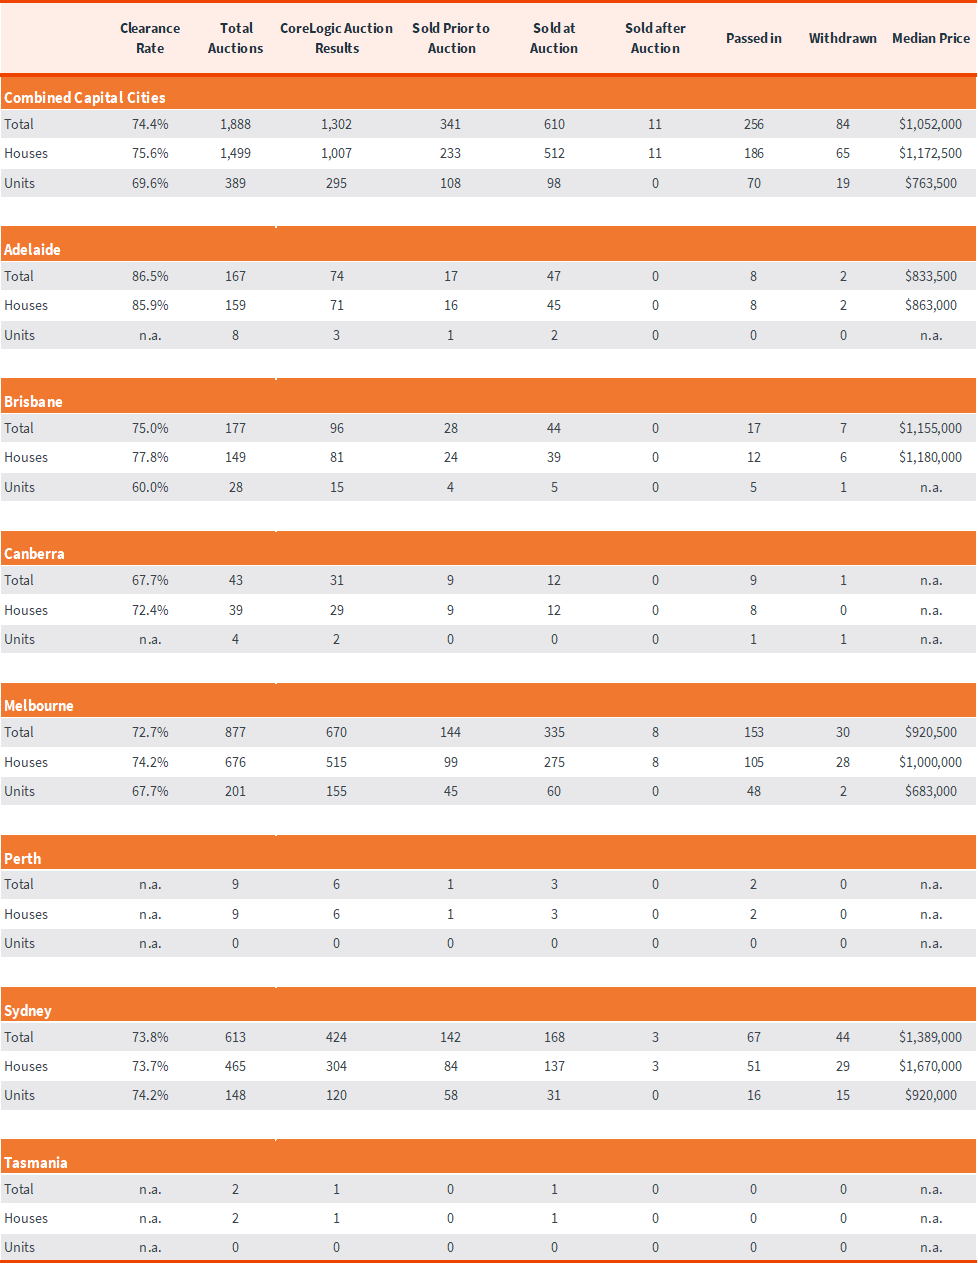
The above results are preliminary, with ‘final’ auction clearance rates published each Thursday. CoreLogic, on average, collects 99% of auction results each week. Clearance rates are calculated across properties that have been taken to auction over the past week.
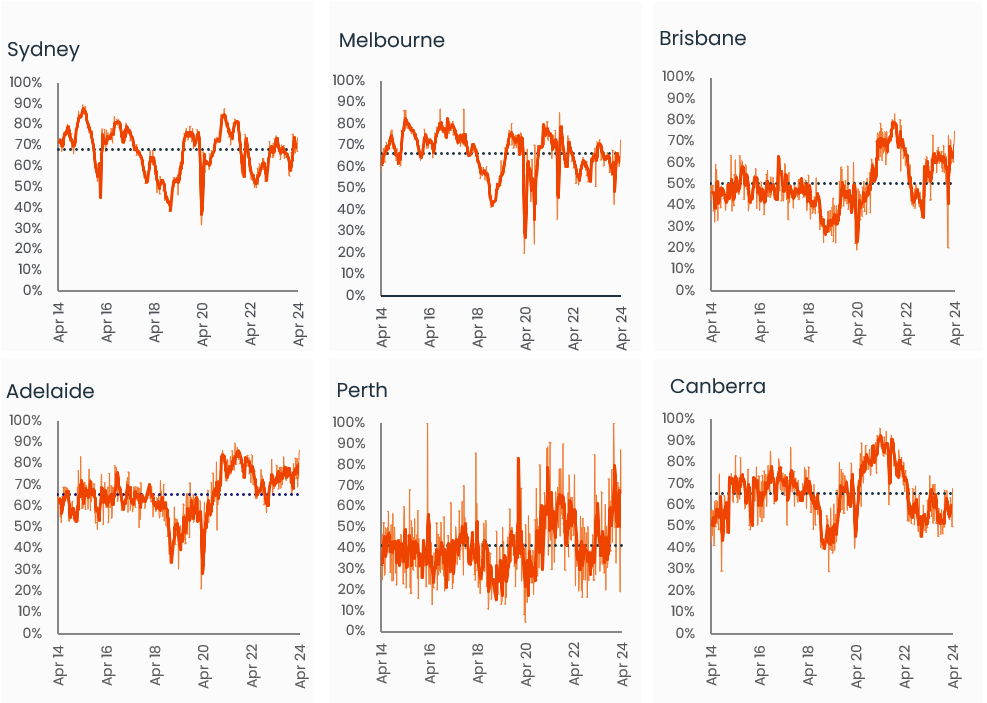
Sub-region auction statistics (preliminary)
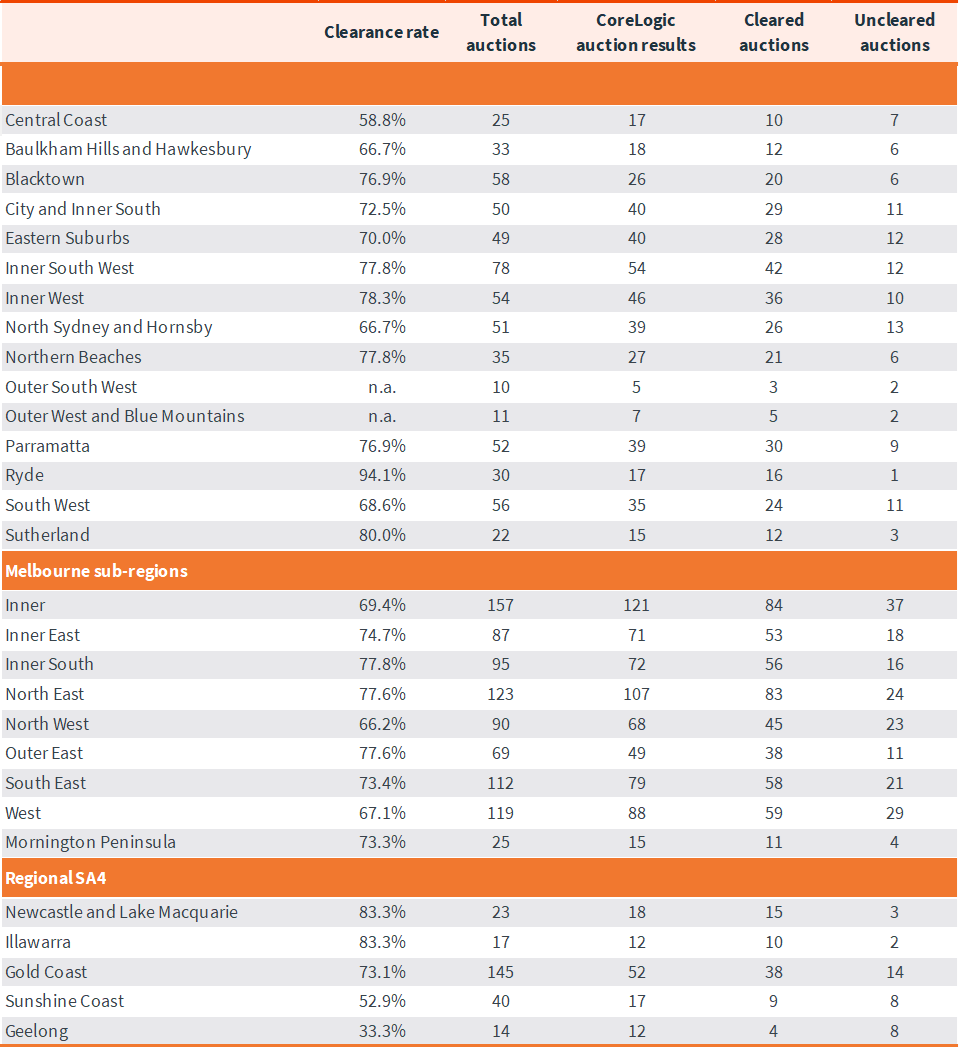
CoreLogic, on average, collects 99% of auction results each week. Clearance rates are calculated across properties that have been taken to auction over the past week.
Download Property Market Indicator Summary

Meet Caitlin Fono
Sr Associate, Research Support
Caitlin has spent more than a decade working with property data and analytics in various roles, earning a position on the CoreLogic research team in 2013. As a respected and highly experienced research analyst, Caitlin works with high frequency data sets, regularly updating our widely read auction reporting, weekly activity updates and customised data briefs.
Full profile